Your Electricity Costs Broken Down: A Practical Guide
Last updated:
11 min read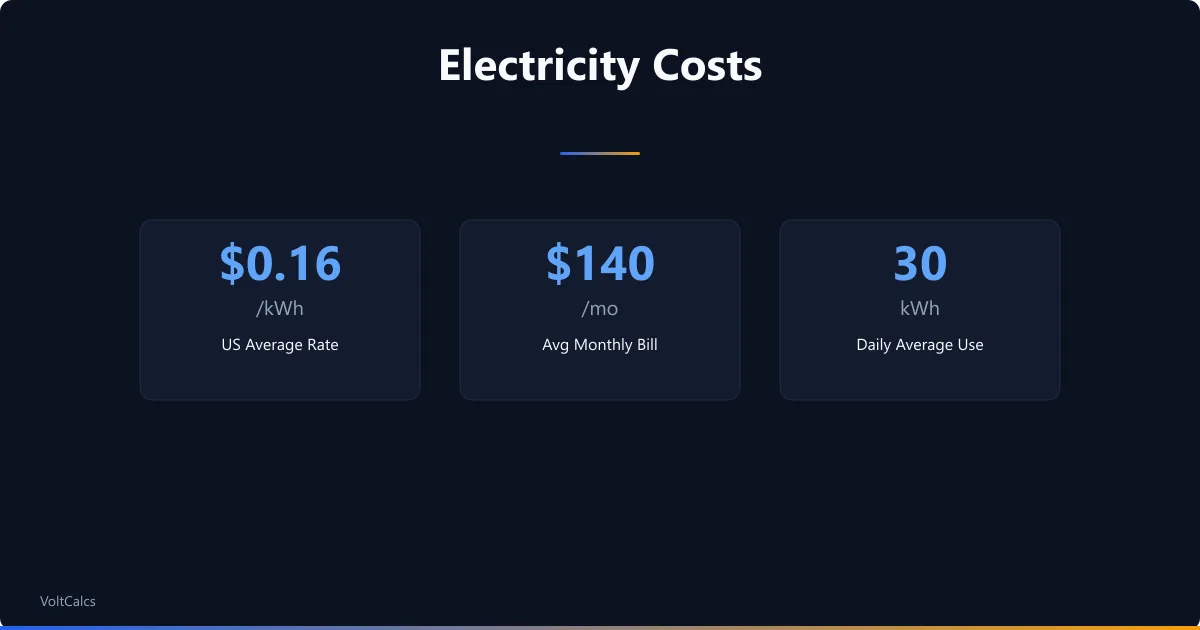
Your electricity bill arrives as a single number, but that number is built from a stack of components: energy charges, delivery fees, demand charges, taxes, and surcharges that vary by utility, state, and rate plan. Understanding what you are actually paying for is the first step to paying less — and the cost per kWh calculator helps you find your true effective rate once you untangle the line items.
Anatomy of a Real Electric Bill
Here is what a typical residential electric bill in a mid-Atlantic state looks like, broken down line by line.
Customer charge: $12.50/month. This is a fixed fee for being connected to the grid. You pay this even if you use zero electricity. It covers metering, billing, and maintaining the service connection to your home.
Energy charge: 872 kWh x $0.1145/kWh = $99.84. This is the cost of the actual electricity you consumed. The rate per kWh may be flat or tiered (higher rate above a baseline usage threshold). This is the component you reduce by using less electricity or by generating your own with solar.
Distribution charge: 872 kWh x $0.0423/kWh = $36.88. This pays for the local utility to deliver electricity from the transmission grid to your house through the distribution network — transformers, poles, wires, and crews. You pay this even if you buy electricity from a competitive supplier instead of the utility.
Transmission charge: 872 kWh x $0.0198/kWh = $17.27. This covers the high-voltage transmission grid that moves electricity from power plants to the local distribution network. Regulated by FERC at the federal level.
Taxes, surcharges, and riders: $14.82. State and local taxes, renewable energy fund surcharges, grid modernization riders, and other regulatory fees. These vary widely by state and can add 5-15% to the base bill.
Total bill: $181.31 for 872 kWh. The effective rate is $181.31 / 872 = $0.2079/kWh. That is 82% higher than the advertised energy rate of $0.1145/kWh because it includes all the non-energy charges. Your true cost per kWh — the number that matters for solar payback calculations and appliance cost comparisons — is the total bill divided by total kWh.
Use our amps draw calculator to compute how much current each appliance pulls at your voltage. It is the first step toward understanding where your money goes.
How Electricity Pricing Works
Flat rate is the simplest structure: every kWh costs the same amount regardless of when you use it or how much you use. Most US residential customers are on flat-rate plans. The rate is set by your state public utility commission and changes periodically (usually annually). The national average residential rate was approximately $0.16/kWh in 2025 according to the EIA, but state averages range from $0.10 (Idaho, Utah) to $0.35+ (Hawaii, Connecticut, Massachusetts).
Tiered pricing charges a low rate for a baseline amount of usage and higher rates above that threshold. California's PG&E, for example, has historically used tiered rates where the first 300 kWh/month costs less than the next 300 kWh, which costs less than anything above 600 kWh. Tiered pricing penalizes high usage and rewards conservation.
Time-of-use (TOU) pricing charges different rates at different times of day. Electricity is more expensive during peak demand hours (typically 4-9 PM on weekdays) and cheaper during off-peak hours (nights, early mornings, weekends). The ratio between peak and off-peak rates can be 2:1 or even 3:1. TOU pricing creates financial incentives to shift energy-intensive activities to off-peak hours.
Demand charges are based on your peak instantaneous power draw (measured in kW) during a billing period, not your total energy use. If you run an air conditioner, dryer, oven, and pool pump simultaneously for 15 minutes, that 15-minute peak sets your demand charge for the entire month. Demand charges are common on commercial bills and are appearing on some residential bills in states with high grid stress. Staggering large loads avoids demand spikes.
Rate inflation is the hidden factor. US residential electricity rates have risen an average of 2-3% annually over the past decade. Some regions have seen 5-8% annual increases. A $0.15/kWh rate today becomes $0.20/kWh in 10 years at 3% annual inflation. This compound effect is why solar panels become more valuable each year — your savings grow while the system cost is fixed. Our solar payback guide covers this in detail.
What Your Appliances Cost to Run
This table uses the national average effective rate of $0.16/kWh. Multiply by your local rate ratio (your effective rate / $0.16) to adjust for your area. Use the kWh calculator to compute costs for any appliance at your specific rate.
| Appliance | Typical Watts | Daily Use | Monthly kWh | Monthly Cost |
|---|---|---|---|---|
| Central AC (3-ton) | 3,500W | 8 hrs | 840 kWh | $134.40 |
| Electric water heater | 4,500W | 3 hrs | 405 kWh | $64.80 |
| Electric dryer | 5,000W | 1 hr (5x/wk) | 100 kWh | $16.00 |
| Refrigerator | 150W avg | 24 hrs | 108 kWh | $17.28 |
| Dishwasher (with dry cycle) | 1,800W | 1 hr | 54 kWh | $8.64 |
| Electric oven | 2,500W | 1 hr | 75 kWh | $12.00 |
| Desktop computer + monitor | 200W | 8 hrs | 48 kWh | $7.68 |
| LED TV (55") | 60W | 5 hrs | 9 kWh | $1.44 |
| LED bulb (10W equivalent) | 10W | 6 hrs | 1.8 kWh | $0.29 |
| Phone charger | 5W | 3 hrs | 0.45 kWh | $0.07 |
Two appliances dominate the typical electricity bill: air conditioning and water heating. Together they account for 40-60% of annual residential electricity in the US according to the DOE. If you want to cut your bill, these are where to focus — not on unplugging phone chargers. For the audit method that finds your top three loads from the bill alone before you measure anything, see our guide to what appliances actually cost to run at home. Understanding your kVA vs kW relationship also helps — commercial customers billed on apparent power (kVA) can reduce costs by improving power factor without using less energy.
How to Reduce Your Electricity Bill
Focus on the big items first. These steps are ordered by impact, not difficulty.
- Address heating and cooling efficiency. Air sealing and insulation improvements reduce AC and heating runtime. Sealing duct leaks alone can reduce HVAC energy use by 20-30%. If your system is over 15 years old, a modern heat pump operates at 2-3x the efficiency of older systems — it effectively divides your heating and cooling electricity by 2-3.
- Switch to a heat pump water heater. A heat pump water heater uses 60-70% less electricity than a standard electric resistance water heater. On a bill where water heating costs $65/month, that is $40-$45/month in savings. Run your specific gallons-per-day, set temperature, and inlet temperature through our water heater cost calculator to see the payback for your usage. Federal incentives through the Inflation Reduction Act (IRA) cover a portion of the purchase price.
- Switch to TOU pricing if available. If your utility offers time-of-use rates, shifting laundry, dishwashing, EV charging, and other deferrable loads to off-peak hours can reduce the per-kWh cost of those activities by 30-50%. TOU requires behavioral change — you run the dishwasher at 10 PM instead of 7 PM — but the math is compelling for households willing to adjust.
- Upgrade to LED lighting throughout. If you still have incandescent or CFL bulbs, LED replacements use 75-80% less electricity and last 15-25 times longer. A household with 30 bulbs running 6 hours/day saves roughly $150-$250/year by switching entirely to LED. The payback on LED bulbs is under 6 months at current prices.
- Eliminate standby power waste. Standby power (devices in "off" mode that still draw electricity) accounts for 5-10% of residential electricity use — roughly $50-$120/year for the average household. Smart power strips that cut power completely to entertainment centers, home offices, and chargers when not in use address this without requiring you to manually unplug everything.
- Right-size your refrigerator. An older, oversized refrigerator can cost $80-$150/year to run. A modern ENERGY STAR certified refrigerator of the same size costs $40-$60/year. If your fridge is over 15 years old, replacing it pays for itself in energy savings within 3-5 years.
Time-of-Use vs. Flat Rate: Which Saves More?
TOU pricing rewards schedule flexibility. If you can shift 30-50% of your usage to off-peak hours, TOU usually costs less than a flat rate. If your schedule is inflexible (you must run the AC from 3-8 PM, cook dinner at 6 PM, and cannot shift laundry to late evening), flat rate is simpler and may be cheaper.
| Factor | Flat Rate | Time-of-Use |
|---|---|---|
| Rate structure | $0.16/kWh all hours | $0.28 peak / $0.10 off-peak |
| Peak hours | None | Typically 4-9 PM weekdays |
| Best for | Households with fixed schedules | Households that can shift usage |
| Monthly bill (872 kWh, 40% peak) | $139.52 | $150.10 (no shifting) |
| Monthly bill (872 kWh, 20% peak) | $139.52 | $118.19 (with shifting) |
| Solar pairing | All kWh offset equally | Solar offsets peak production hours; battery stores for peak pricing |
The TOU example above shows a $21/month savings when the household shifts half of its peak usage to off-peak hours — that is $252/year. But without load shifting, TOU actually costs $11/month more than flat rate. TOU pricing is a tool for the engaged consumer, not a passive win.
TOU pricing pairs powerfully with solar and battery storage. Solar panels produce the most electricity during midday (often an off-peak period under TOU). A battery stores that excess solar energy and discharges it during the 4-9 PM peak window when TOU rates are highest. This combination maximizes the financial value of every kWh your panels produce. The electrical load calculator can help you profile which appliances run during peak hours and identify the best candidates for shifting.
Hidden Costs on Your Electricity Bill
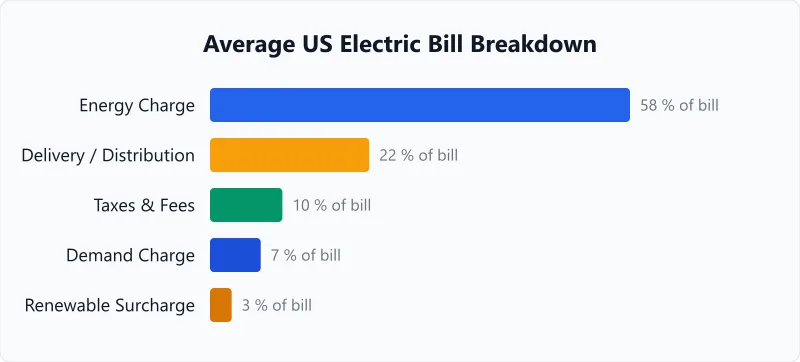
The advertised electricity rate — the one your utility puts in bold on their website — covers only the energy charge. The actual cost per kWh you pay is 40-80% higher once you factor in the line items that most people skip past on their bill.
Delivery charges are the biggest hidden cost. Your utility charges separately for distributing electricity through the local grid (poles, wires, transformers — the same infrastructure where voltage drop in wiring becomes a real engineering concern) and for transmitting it over the high-voltage grid from power plants. These two charges together add $0.04-$0.08/kWh on top of the energy rate.
In New York and parts of New England, delivery charges alone can exceed $0.10/kWh — sometimes matching or exceeding the energy charge itself. You pay delivery charges even if you buy energy from a competitive supplier, because the electricity still travels over the same wires.
Demand charges are rare on residential bills but growing. Utilities in Arizona, Colorado, and parts of the Southeast have introduced residential demand charges on some rate plans. Unlike energy charges (based on total kWh), demand charges are based on your single highest 15-minute power peak during the billing period. Run the AC, dryer, and oven at the same time for 15 minutes and that 8-10 kW spike sets your demand charge for the entire month — typically $5-$12 per kW. The fix is simple: stagger high-wattage appliances so they do not overlap.
Surcharges and riders fund things you never asked for but cannot opt out of: grid modernization programs, renewable portfolio compliance costs, storm recovery bonds, nuclear decommissioning funds, and low-income assistance programs. Each one adds $0.005-$0.02/kWh. They accumulate. A typical mid-Atlantic bill carries 4-6 separate riders that collectively add $15-$25/month to a household using 875 kWh. These charges appear in the fine print of your bill and rarely show up in the rate your utility advertises.
Sales tax applies to electricity in most states but not all. Some states exempt residential electricity from sales tax entirely (Maryland, Pennsylvania). Others tax at the full state rate (Texas charges 6.25% on electricity). A few states apply reduced rates. On a $180 bill, a 6% sales tax adds $10.80 — not trivial over 12 months.
The only way to know your true electricity cost is to divide the total bill (after all charges and taxes) by total kWh consumed. That effective rate is what you should use for every energy decision — from calculating appliance running costs with the HP to watts calculator to estimating solar panel payback periods.
Your Bill in Context: National Averages
The average US household uses about 10,500 kWh per year (875 kWh/month) and pays about $1,680/year for electricity. But averages conceal wide variation. Households in the South use 30-40% more electricity than the national average due to air conditioning. Households in mild climates (Pacific Northwest, Northern California) use 20-30% less.
Your electricity bill is one of the few household expenses you have real control over through efficiency improvements, behavioral changes, and technology upgrades. Unlike mortgage payments or property taxes, your energy costs respond directly to the actions you take.
Start with the biggest line items — heating, cooling, and water heating — and work down. Even modest efficiency gains compound over the 20-30 years you will live in a home, adding up to thousands of dollars in savings. The solar ROI calculator gives you the baseline number to measure potential savings from switching to solar.
Frequently Asked Questions
Written and maintained by Dan Dadovic, Commercial Director at Ezoic Inc. & PhD Candidate in Information Sciences. He works professionally as Commercial Director at Ezoic Inc., leading revenue strategy across digital publishing.
Disclaimer: Calculator results are estimates based on theoretical formulas. Actual performance varies with temperature, battery age, load patterns, and equipment condition. For critical electrical work, consult a licensed electrician.
Editorial review by Doc. dr. sc. Danijel Jerković-Štil, Assistant Professor, FERIT Osijek.