Steps to Evaluate Solar as an Investment
- Get at least three installer quotes. Prices vary 20-40% between installers in the same city. Each quote should itemise equipment, labour, permitting, and interconnection fees. A national average as of early 2026 sits around $2.75-3.25 per watt installed, so a 6kW system runs $16,500-$19,500 before credits.
- Look up your actual electricity rate. Your utility bill shows the rate per kWh — not the total bill divided by usage, which includes fixed charges. The rate that matters is the marginal rate: the price of the last kWh you consume. Some utilities have tiered rates where solar offsets the most expensive tier first, making the payback faster than average-rate calculations suggest.
- Calculate your net cost after the tax credit. The federal ITC reduces your tax liability by 30% of the total system cost through 2032 under the Inflation Reduction Act. An $18,000 system nets a $5,400 credit, dropping your effective cost to $12,600. State incentives and utility rebates can reduce it further — check the DSIRE database for your state.
- Compare 25-year savings to your net cost. A 6kW system in a 5-sun-hour location produces roughly 27kWh/day (after losses). At $0.16/kWh with 3% annual rate increases, that electricity is worth about $65,000 over 25 years. Against a $12,600 net cost, the return dwarfs most conservative investments. Use our solar panel output calculator to refine the daily production estimate for your specific setup.
How the Federal Solar Tax Credit Works
The federal Investment Tax Credit lets you deduct 30% of your total solar installation cost from your federal income taxes. This is a credit, not a deduction — it reduces your tax bill dollar for dollar. If your system costs $20,000, you owe $6,000 less in federal taxes. If your tax liability in the installation year is less than the credit amount, you can roll the remainder into the following tax year.
The 30% rate applies to systems installed between 2022 and 2032. It steps down to 26% in 2033 and 22% in 2034, then expires for residential installations after 2034 unless Congress extends it. The credit covers panels, inverters, racking, wiring, labour, battery storage (even if added later), and certain roof work directly related to the installation.
Many states stack additional incentives on top. New York offers up to $5,000 in state tax credits. Massachusetts has the SMART program paying per kWh produced. California's NEM 3.0 reduced export rates but pairing solar with batteries restores much of the value. Check the DSIRE database for current incentives in your state.
Sample Payback Periods by Region
| Scenario | Electricity Rate | Sun Hours | Net Cost (after 30% ITC) | Payback Period |
|---|---|---|---|---|
| Arizona (high sun) | $0.14/kWh | 6.5 hrs | $12,600 | ~8 years |
| Massachusetts (high rate) | $0.28/kWh | 4.0 hrs | $14,000 | ~6 years |
| Texas (moderate) | $0.13/kWh | 5.5 hrs | $11,900 | ~9 years |
| Oregon (low sun) | $0.12/kWh | 3.5 hrs | $13,300 | ~14 years |
| California (high rate + NEM 3.0) | $0.32/kWh | 5.5 hrs | $15,400 | ~5 years |
These estimates assume a 6kW system, 0.5% annual panel degradation, 3% annual electricity rate increases, and 15% system losses. Your actual payback depends on your specific utility rate structure, net metering policy, and local incentives.
High-rate states like California and Massachusetts consistently show the fastest paybacks despite having fewer sun hours than the Southwest, because the value of each kWh offset is much higher. Use our solar panel and battery sizing calculator to determine whether adding storage improves your economics under time-of-use billing.
Worked Examples
Average American Home Going Solar
Context
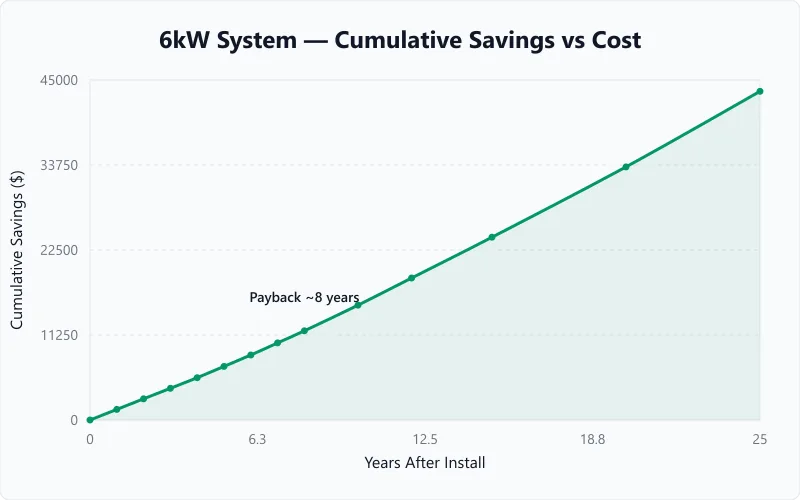
A homeowner in North Carolina installs a 6kW solar system for $18,000. Their electricity rate is $0.16/kWh, the area gets 5 peak sun hours per day, and they expect 3% annual rate increases. Panel degradation is 0.5% per year. They claim the full 30% federal tax credit.
Calculation
Net cost after 30% ITC = $18,000 × 0.70 = $12,600
Year 1 daily production = 6kW × 5h × 0.85 (losses) = 25.5 kWh/day
Year 1 annual production = 25.5 × 365 = 9,308 kWh
Year 1 savings = 9,308 × $0.16 = $1,489
Cumulative savings exceed $12,600 net cost in year 8
Interpretation
The system pays for itself in about 8 years. Over 25 years, cumulative savings reach approximately $55,000-$60,000 depending on actual rate increases. That represents a return of roughly 4.4x the net investment. Use the solar panel size calculator to confirm the array wattage matches your roof space and daily consumption.
Takeaway
An 8-year payback on a system warrantied for 25 years means 17 years of effectively free electricity. The 30% ITC is the single biggest factor shortening that payback — without it, the same system takes about 11 years.
High-Rate State Investment
Context
A homeowner in Massachusetts installs an 8kW system for $24,000. Their electricity rate is $0.28/kWh (among the highest in the US), the area averages 4.5 peak sun hours, and they expect 4% annual rate increases due to regional grid costs. Panel degradation is 0.5% per year with the full 30% federal credit.
Calculation
Net cost after 30% ITC = $24,000 × 0.70 = $16,800
Year 1 daily production = 8kW × 4.5h × 0.85 = 30.6 kWh/day
Year 1 annual production = 30.6 × 365 = 11,169 kWh
Year 1 savings = 11,169 × $0.28 = $3,127
Cumulative savings exceed $16,800 net cost in year 5
Interpretation
Despite lower sun hours than the Southwest, the high electricity rate drives a 5-year payback — one of the fastest in the country. Over 25 years, this system saves roughly $120,000-$130,000 at 4% annual rate increases. The cost per kWh calculator can help you verify your actual blended utility rate if you have tiered pricing.
Takeaway
High electricity rates trump high sun hours for ROI. Massachusetts homeowners often see better financial returns from solar than Arizona residents, even with 20% fewer sun hours, because each offset kWh is worth nearly twice as much.
Frequently Asked Questions
Glossary
Payback Period
The number of years it takes for cumulative electricity savings to equal the net cost of a solar installation. After payback, every kWh produced is effectively free. Most residential systems reach payback in 6-12 years depending on electricity rates and local sun hours.
Net Metering
A billing arrangement where excess solar electricity sent to the grid earns credits on your utility bill, typically at the full retail rate. Net metering effectively turns the grid into a free battery — you export surplus during the day and draw credited power at night. Policies vary widely by state and utility.
Panel Degradation Rate
The annual percentage decrease in a solar panel's electricity output as it ages. Most modern panels degrade 0.3-0.5% per year, meaning a panel rated at 400W produces about 380W after 10 years and 350W after 25 years. Manufacturers guarantee minimum output (typically 80-85% of rated) at the 25-year mark.
Not sure how many panels fit on your roof? Our solar power roof area calculator tells you the maximum array size for your available space.
Related calculators
Electricity Cost Calculator
See the daily, monthly, and annual electricity bill impact of running any device. Plug in wattage, hours, and your utility rate for a full cost breakdown.
Electrical
Electricity Bill Estimator
Estimate your full monthly electricity bill by category: HVAC, water heating, fridge, lighting, electronics, cooking, laundry, plus fixed delivery charges.
Electrical
Solar Panel Calculator
Free solar panel calculator: enter your daily energy use and sun hours to get the panel wattage and number of panels for a home, RV, or off-grid setup.
Solar
Solar Panel Output Calculator
Calculate daily and monthly energy output from your solar panels. Enter wattage, sun hours, and panel count for instant results.
Solar
Solar ROI depends on three things you can look up in 10 minutes: your electricity rate, your location's sun hours, and the installed cost from a local quote. Plug those real numbers in above — generic industry averages hide whether solar makes sense for your specific house. The federal 30% tax credit remains the single biggest lever through 2032, so timing matters. Households charging an EV from a rooftop array see some of the cheapest per-mile driving costs in the US — our walkthrough of the four levers that drive EV charging cost shows how solar+EV ranks against the other driver profiles. Our solar payback period guide walks through the full calculation step by step, including how financing choices affect your return.
More Solar calculators
Browse all solar calculators — Panel output, battery bank sizing, charge time, and system design for off-grid, RV, and residential setups.
Last updated:
Written and maintained by Dan Dadovic, Commercial Director at Ezoic Inc. & PhD Candidate in Information Sciences. He works professionally as Commercial Director at Ezoic Inc., leading revenue strategy across digital publishing.
Disclaimer: Calculator results are estimates based on theoretical formulas. Actual performance varies with temperature, battery age, load patterns, and equipment condition. For critical electrical work, consult a licensed electrician.
Editorial review by Doc. dr. sc. Damir Topić, Assistant Professor, FERIT Osijek.