What Appliances Actually Cost to Run at Home
Last updated:
11 min read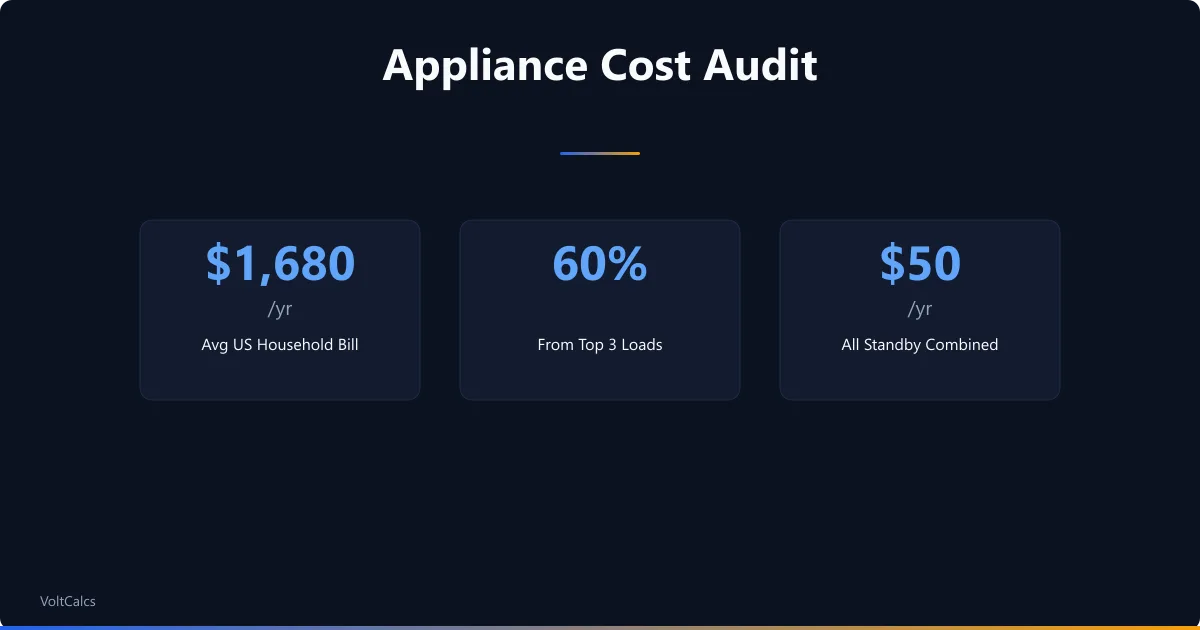
Most US households spend $1,400-$2,000 per year on electricity, but the line items behind that number are wildly uneven. Three or four loads do almost all the damage, and the rest add up to less than people think. The fastest way to cut your bill is not unplugging chargers — it is finding which appliances are quietly burning the bulk of your kWh, then deciding whether to replace them, run them differently, or accept the cost. The appliance electricity cost calculator handles the per-device math; this guide walks through the audit method that tells you which devices to plug into it first.
The 90/10 Pattern Behind Every Electricity Bill
If you list every appliance in a typical home and rank them by annual cost, the top three or four account for 50-70% of the bill. The next ten cover another 20-25%. Everything else combined — phone chargers, lamps, microwaves used twice a day, the toaster, the kettle, the smart speaker — adds up to single-digit percentages. This is not a quirk of one or two homes. The same shape repeats across climate zones, square footages, and rate plans because the physics is the same: a few loads have very high wattage, very long duty cycles, or both.
The EIA Residential Energy Consumption Survey shows the same top categories year after year: space heating, space cooling, water heating, and refrigeration. Together those four account for 55-70% of residential electricity in homes where heating runs on electricity, and 40-55% in homes that heat with gas or oil. If your bill is high and you do not know which appliance is responsible, statistics say the answer is one of those four. Our electricity bill estimator reflects this distribution by category — it asks for HVAC, water heating, refrigeration, and a handful of others, not for individual appliances, because the long tail does not change the bill total enough to be worth itemizing.
The Pareto pattern matters because it changes how you spend audit effort. Spending an hour with a Kill A Watt on every device in the house is mostly wasted time. Spending the same hour on the top three — measuring the fridge over 24 hours, getting an accurate hourly draw on the AC, checking the water heater's actual recovery rate — gives you the data that drives real decisions.
A 30-Minute Audit That Beats Guesswork
The starting point is your bill, not your appliances. Pull the last 12 monthly bills from your utility website (most utilities show at least two years of history). Look at the kWh column, not the dollar column. Two patterns reveal almost everything.
First: how much does your usage swing seasonally? A flat line — same kWh in January as in July — means HVAC is not your dominant load, so the top of the list is probably water heating, refrigeration, or pool/well pumps. A summer spike means central or window AC is the top slot. A winter spike means electric heating (resistance, baseboard, or heat pump) is the top slot. A double peak in both seasons means HVAC dominates year-round.
Second: what is your shoulder-season baseline — the kWh used in April or October, when neither heating nor cooling is running much? That number is your "always-on" load: refrigeration, lighting, electronics, water heating, well pumps, and any electric devices that run no matter the weather. If your shoulder-month bill is 700-900 kWh, your always-on load is normal. Above 1,000 kWh and something is unusual — often a hot tub, pool pump, well pump in a poorly insulated well house, or an old refrigerator pulling 250-300W average.
From there, three questions narrow the diagnosis fast. What heats your home and water: gas or electric? How old is the refrigerator and is there a second one (basement, garage)? Are there any "always running" loads (pool, hot tub, sump pump, well pump, aquarium, dehumidifier) that you have stopped noticing? Answer those three and you have your top suspects without measuring anything yet. Now you measure those specific loads with a Kill A Watt or smart plug, leaving every-other-room electronics alone.
Heating and Cooling: Always the Top Slot
HVAC dominates because it combines high wattage with long duty cycles in extreme weather. A central AC compressor pulls 3,000-4,500W when running. In a hot week with the unit cycling on for half of every hour for 16 hours a day, that is 24-36 kWh per day or roughly $4-6 per day at $0.16/kWh. Stretched across a 90-day cooling season, it is $360-540 just for the AC, even before you account for backup electric resistance heating from the air handler.
Resistance electric heating is even more expensive. A baseboard or wall heater pulls 1,500W flat-out and runs continuously when the room is not warm enough. Two or three rooms heated by resistance baseboards in a cold climate routinely add $300-600 to the bill per heating month. A single 1,500W space heater used 8 hours a day for 5 winter months adds about $150-200 per unit at $0.16/kWh — and people often run several at once in cold rooms a central system cannot reach.
The size of the savings opportunity matches the size of the cost. Sealing duct leaks alone reduces HVAC runtime 20-30% in homes with attic or crawlspace ductwork, which is most of the US housing stock. Adding insulation to an undersealed attic typically cuts heating and cooling runtime 15-25%. Replacing a 15-year-old central AC unit with a modern variable-speed heat pump cuts cooling electricity 30-50% and electrifies heating at 2-3× the efficiency of resistance. None of these are small fixes, but the payback math works at today's rates because the underlying load is so large to start with. The DOE's heat pump systems guide walks through the technology choice in detail.
If your bill is dominated by HVAC, every other appliance audit is secondary. Get the heating-and-cooling number right first; the rest is rounding error in comparison.
Always-On Loads You Stop Noticing
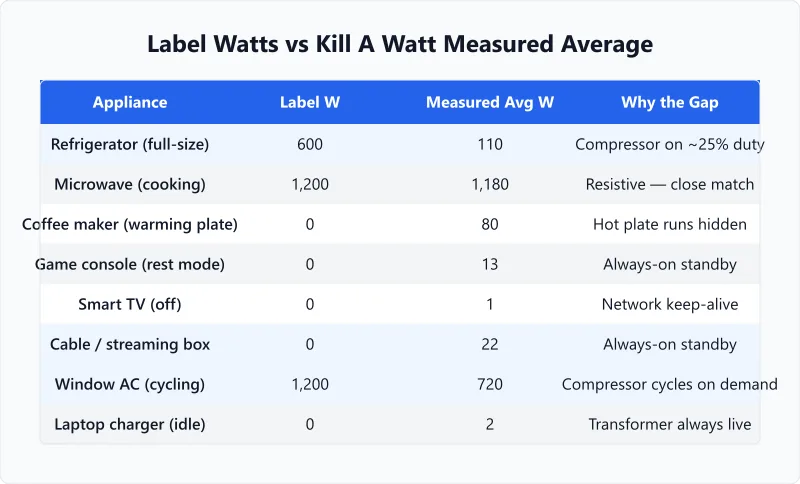
The second category is loads that run continuously or near-continuously — and that you stopped consciously thinking about years ago. The biggest is your refrigerator, which averages 80-150W continuously on a modern Energy Star model and 200-300W on units more than 12-15 years old. Refrigeration is the only common appliance with a 100% duty cycle, so even modest wattage adds up to real money: 100W average × 24 hours × 365 days × $0.16 = $140 per year. Old or oversized fridges, or any second fridge in a hot garage, can run $250-350 per year individually.
Well pumps and sump pumps fall into the same bucket. A 1HP submersible well pump pulls 1,200-1,500W when running, and in a typical residential setup it cycles on briefly hundreds of times per day. The total energy is usually $80-150 per year. A constantly running pond pump or aquarium chiller is more expensive — easily $200-400 per year for a large display tank — and it almost never shows up in homeowners' mental models because it has been quietly running since the day it was plugged in.
Network gear and standby boxes are the smallest of the always-on category but the most numerous. A cable or streaming box pulls 15-30W in standby. A WiFi router and mesh nodes draw 10-20W combined, around the clock. A home network rack with a switch, a NAS, and security cameras can pull 50-100W continuously. None of these is large in isolation, but they collectively run $80-200 per year for a modestly equipped home — comparable to running an extra fridge.
The audit move for always-on loads is to total their continuous wattage and multiply by 8,760 hours. For a single 50W combined network and standby load, that is 438 kWh per year or $70 at $0.16/kWh. The number is rarely worth a hardware change on its own, but it sets a realistic floor for what your home draws when nothing is actively in use.
Episodic Loads That Hit Hard When They Run
The third bucket covers loads that draw enormous wattage but only intermittently — electric ovens, dryers, dishwashers, hot tubs, EV chargers, electric kettles, and resistive cookware. They are hard to budget mentally because the per-cycle cost is small but the cycles add up.
An electric clothes dryer draws 4,500-5,500W during the heating phase of a cycle, but a typical 45-minute load uses around 3-3.5 kWh — about $0.55 at $0.16/kWh. Run five loads a week and that is $14 per month or $170 per year. A dishwasher with a heated dry cycle uses 1.5-2 kWh per cycle, or $40-50 per year for nightly use. An electric oven at 3,000-4,000W heating up and holding 350°F for an hour uses 2-2.5 kWh, or $60-100 per year if used three times a week.
The two episodic loads that surprise people are EV charging and hot tubs. A typical Level 2 home charger pulls 7,200W and is the largest single load in many EV-owning homes. Charging an EV that drives 12,000 miles per year at 3.5 miles per kWh costs about $548 annually at $0.16/kWh — comparable to a large central AC bill. Our EV charging cost calculator breaks the math down by Level 1 vs Level 2 vs DC Fast and shows the cost-per-mile gap, which is usually the figure that matters more than the monthly total. The EV cost spread across charging location, rate plan, and driver behavior is wide enough that five EV-driver cost profiles can run from under $200 to over $1,650 per year on the same car.
A hot tub is the worst offender per-unit-of-pleasure in most homes. Maintaining 102°F water year-round in an outdoor tub uses 2,500-5,000 kWh per year depending on insulation, climate, and cover quality — that is $400-800 per year before anyone gets in. Even a well-insulated tub costs $250-400 per year just to maintain temperature. Anyone whose bill jumped after installing a hot tub is looking at the right culprit.
The Small-Stuff Myth: LEDs, Chargers, and Standby
The cultural narrative around saving electricity is wildly miscalibrated. People feel virtuous for unplugging their phone charger and feel resigned about their HVAC, when the math runs the opposite direction. A USB phone charger left in the wall with no phone attached pulls about 0.1-0.5W. Across an entire year that is roughly 1-4 kWh, or $0.16-0.64 in cost. All of the phone chargers in a typical house, combined, cost less than running the AC for a single day in summer.
LED bulbs are a similar story. A 10W LED running 6 hours a day uses 22 kWh per year — about $3.50. An entire house with 30 LED bulbs at the same usage costs roughly $100 per year for all lighting combined. That is a real number, but it is dwarfed by a single bad fridge ($250+ per year) or a hot tub ($500+). The lighting upgrade is still worth doing, but framing it as the headline savings is wrong.
Standby loads from electronics deserve more attention than chargers but less than the main characters. A modern smart TV draws 0.5-1W when "off" but with network-keep-alive enabled. A game console in rest mode pulls 8-15W. A cable box draws 15-30W. Total all the standby loads in a typical entertainment center and you might add up to 50-80W continuously, or $70-110 per year. A smart power strip that cuts power to peripherals when the TV turns off recovers most of that — but the recovered amount is small relative to addressing one HVAC inefficiency.
The right framing is proportional. Spend optimization effort in proportion to the cost. Standby fixes are worth doing once, not worth iterating on. LED bulb replacement is worth doing once, then forgetting about. HVAC efficiency, water heating, and refrigeration are worth revisiting every few years as new technology and incentives shift the math.
Build Your Cost Ledger: A Field-Audited Example
Here is how the audit method plays out in a real 2,000 sqft single-family home in a mixed climate, with two adults, one EV, no pool or hot tub, and a 14-year-old central AC unit.
The annual bill breakdown after a weekend with a Kill A Watt and a smart panel monitor looks roughly like this. Central AC and electric resistance backup heating: 4,200 kWh, or $672. Electric water heater (50-gallon tank, average household use): 4,100 kWh, or $656. EV home charging: 3,400 kWh, or $544. Refrigerator and chest freezer in garage: 1,400 kWh combined, or $224. Electric clothes dryer: 850 kWh, or $136. Cooking (electric range and microwave): 600 kWh, or $96. Lighting (mostly LED): 380 kWh, or $61. Network and standby loads: 450 kWh, or $72. Everything else combined (computers, TVs, small appliances): 720 kWh, or $115.
That total comes to roughly 16,100 kWh and $2,576 per year — high for a typical home, mostly because of the EV. The top three loads (HVAC, water heating, EV) account for $1,872, or 73% of the bill. The bottom four categories combined (lighting, network, miscellaneous electronics, and small appliances) total $363, or 14% of the bill. The math says: optimization effort spent on the top three pays back ten times what the same effort spent on the bottom four would.
For this household, the priority list is heat-pump replacement of the AC and resistance heat (cuts the top category by 40-50%, saves $250-350 per year), a heat-pump water heater swap (cuts the second category by 60-70%, saves $400-450 per year), and a time-of-use rate plan for EV charging if the utility offers one (shifts the third category to off-peak rates, saves $100-200 per year). Three changes, $750-1,000 per year in savings, and the rest of the home stays exactly as it is.
Where to Spend the Effort First
Audits are useful only if they change behavior. The hardest part of the process is not measurement — it is resisting the temptation to act on every small finding. Three buckets cover where the effort actually pays back.
Bucket one: replacement of the dominant loads. Heat pumps for HVAC and water heating, modern fridges to replace anything older than 12-15 years. These are the only changes that move the bill total by hundreds of dollars per year. They cost real money up front, but federal incentives through the Inflation Reduction Act and state-level rebates often cover 30-50% of the price.
Bucket two: rate plan and behavior shifts. Switch to time-of-use rates if you have flexible usage and a utility that offers them. Run the dishwasher and laundry overnight instead of during peak hours. Charge the EV between midnight and 6 AM. None of these cost anything; they just require attention. For a closer look at rate structures and how the per-kWh rate is built up, see our guide on the anatomy of an electricity bill.
Bucket three: baseline efficiency that compounds with everything else. Insulation, air sealing, LED lighting, smart power strips on entertainment centers. These are one-time upgrades with payback in 1-3 years. They are not headline savings, but they reduce the size of every other load category by a few percent, which compounds in homes that also do bucket-one work. To see how solar would shift the same equation by replacing grid kWh with on-site generation, plug your numbers into our solar ROI calculator for a full payback breakdown.
Frequently Asked Questions
Written and maintained by Dan Dadovic, Commercial Director at Ezoic Inc. & PhD Candidate in Information Sciences. He works professionally as Commercial Director at Ezoic Inc., leading revenue strategy across digital publishing.
Disclaimer: Calculator results are estimates based on theoretical formulas. Actual performance varies with temperature, battery age, load patterns, and equipment condition. For critical electrical work, consult a licensed electrician.
Editorial review by Doc. dr. sc. Danijel Jerković-Štil, Assistant Professor, FERIT Osijek.