Solar Panel Payback Period: How to Calculate ROI
Last updated:
12 min read
The average solar panel payback period in the United States is 6-10 years, but that average hides enormous variation. A homeowner in Massachusetts paying $0.28/kWh with strong state incentives might break even in 5 years. A homeowner in a low-rate state with no local incentives might wait 12+ years. The difference is not sunlight — it is electricity price, incentives, and system cost.
Our solar ROI calculator runs these numbers for your specific situation. This guide walks through the full calculation so you understand what drives the result and can spot when a solar installer's projections are optimistic.
How to Calculate Your Solar Payback Period
The payback calculation has five steps. Each one uses numbers you can find on your electricity bill, installer quotes, and government incentive databases.
- Determine your annual electricity cost. Pull your last 12 monthly electricity bills. Add up the total charges (not just the kWh charge — include delivery fees, demand charges, and taxes that solar offsets). If you do not have 12 months of bills, multiply a recent bill by 12 and adjust for seasonal variation. The cost per kWh calculator helps you break down your effective rate. For a typical US household using 10,500 kWh/year at the national average of $0.16/kWh, annual electricity cost is about $1,680.
- Estimate your solar system production. A well-designed solar system offsets 80-100% of your annual electricity. Use your roof orientation, local sun hours, and system size to estimate annual production in kWh. Our solar panel output calculator gives you this number. A typical 8 kW system in a mid-latitude US city produces 10,000-12,000 kWh per year.
- Calculate annual savings. Multiply your annual solar production (kWh) by your effective electricity rate ($/kWh). If your system produces 10,500 kWh and your rate is $0.16/kWh, annual savings are $1,680. With net metering, excess production earns credits at retail rate in most states; without it, excess power may be worth less. Factor this in if your system produces 20%+ more than you consume.
- Calculate net system cost. Start with the total installed cost from your installer quote (as of early 2026, residential solar averages $2.75-$3.50 per watt before incentives). Subtract the federal Investment Tax Credit (ITC) and any state/local incentives. For an 8 kW system at $3.00/watt: gross cost is $24,000. After the 30% federal ITC ($7,200), net cost is $16,800.
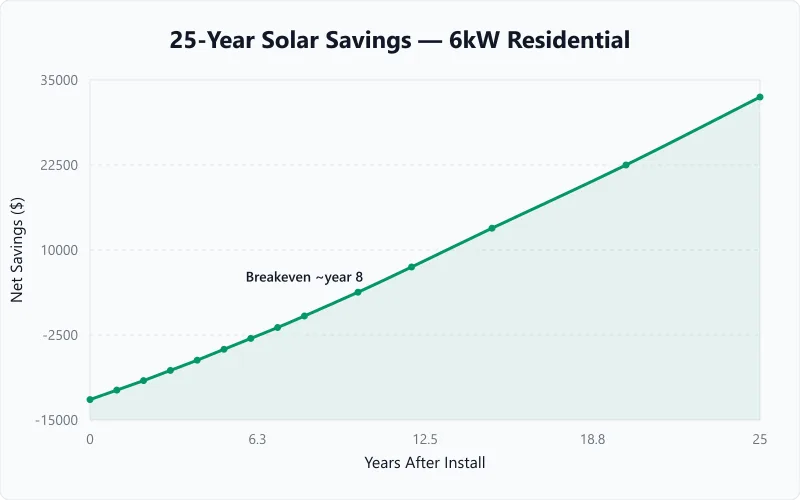
- Divide net cost by annual savings. $16,800 / $1,680 = 10.0 years. That is your simple payback period. The actual payback is slightly shorter because electricity rates rise annually — typically 2-3% per year — which increases your savings over time while your solar cost is fixed.
If your payback comes out longer than 12 years, scrutinize the inputs. Low electricity rates, north-facing roofs, heavy shading, or missing state incentives are the usual culprits. If it is under 6 years, double-check that your incentive assumptions are correct — that is an excellent return but worth verifying.
Cost Breakdown: Where the Money Goes
| Cost Component | Typical Range (8 kW system) | % of Total |
|---|---|---|
| Solar panels (modules) | $4,800-$7,200 | 25-30% |
| Inverter(s) | $2,000-$4,000 | 10-15% |
| Mounting and racking | $1,500-$2,500 | 7-10% |
| Electrical (wiring, disconnect, panel upgrades) | $1,000-$2,000 | 5-8% |
| Permitting and inspection | $500-$1,500 | 3-6% |
| Labor (installation) | $4,000-$7,000 | 20-30% |
| Overhead, margin, customer acquisition | $3,000-$5,000 | 15-20% |
Panel costs have dropped dramatically — as of early 2026, modules represent only 25-30% of total system cost. The largest remaining cost categories are labor and soft costs (permitting, overhead, sales). This is why installation prices vary widely between markets even though the hardware is the same everywhere.
Battery storage (if included) adds $8,000-$15,000 to system cost. Batteries add 5-8 years to payback unless you have time-of-use rates where storing solar energy to use during peak hours generates real savings. Our solar battery bank sizing guide covers the decision between battery-backed and grid-only systems. For a pure economic analysis, grid-connected solar without batteries has the shortest payback.
Federal and State Incentives
The federal Investment Tax Credit (ITC) reduces your solar cost by 30% through at least 2032. This is a tax credit, not a deduction — it directly reduces your federal tax liability dollar for dollar. You need sufficient tax liability in the year of installation (or the following year with a carryover) to claim the full credit.
State incentives vary enormously and change frequently. Check the DSIRE database for current programs in your state. Common state-level incentives include:
State tax credits. Some states offer an additional 10-25% tax credit on top of the federal ITC. These can reduce payback by 1-3 years.
Solar Renewable Energy Credits (SRECs). In states with renewable portfolio standards, your system generates tradable credits worth $10-$400+ per megawatt-hour depending on the market. New Jersey, Massachusetts, and Illinois have particularly valuable SREC markets.
Property tax exemptions. Many states exempt the added home value from solar panels from property tax assessments. Without this exemption, the $20,000+ system that increases your home value would also increase your annual property tax.
Sales tax exemptions. Some states exempt solar equipment from sales tax, saving 5-10% of hardware costs.
The difference between a state with strong incentives and one with none can be 3-5 years of payback period. This is the single most important variable after electricity rate.
Cash vs. Loan vs. Lease: Financing Compared
How you pay for solar fundamentally changes the economics. Each option has different payback characteristics.
| Factor | Cash Purchase | Solar Loan | Lease / PPA |
|---|---|---|---|
| Upfront cost | $16,800 (after ITC) | $0-$3,000 | $0 |
| Monthly payment | None | $120-$180 | $80-$150 |
| You own the system | Yes | Yes (after payoff) | No |
| ITC benefit goes to | You | You | Leasing company |
| Payback period | 6-10 years | 10-15 years | Immediate (lower bill day 1) |
| 25-year total savings | Highest | Moderate | Lowest |
| Home sale impact | Increases value | Increases value (after payoff) | Complicates sale (lease transfer) |
Cash purchase gives the highest total return but requires $15,000-25,000 upfront. You capture the full ITC, pay no interest, and own an appreciating asset from day one. This is the best financial option if you have the funds.
Solar loans (typically 10-20 year terms at 4-8% interest as of early 2026) let you own the system with little or no money down. Monthly loan payments are ideally lower than your previous electricity bill, creating positive cash flow from month one. Interest costs extend the true payback period by 2-4 years versus cash. Shop loan rates aggressively — the difference between 5% and 7% over 15 years is thousands of dollars.
Leases and PPAs (Power Purchase Agreements) require zero upfront cost and zero maintenance responsibility. The leasing company owns the system, claims the ITC, and sells you the electricity at a fixed rate that is lower than your utility rate. Monthly savings are immediate but smaller, and total 25-year savings are 30-50% less than ownership. The biggest drawback: a leased system can complicate home sales because the buyer must agree to assume the lease.
Variables That Shift Your Payback
Electricity rate is the dominant variable. At $0.10/kWh, payback on an 8 kW system is about 14-16 years. At $0.25/kWh, the same system pays back in 5-7 years. If your utility has announced rate increases (many have 3-5% annual increases baked in), solar becomes more valuable each year because your savings grow while your cost stays fixed.
Net metering policy determines the value of excess production. Full retail net metering credits excess solar at your full electricity rate. Some utilities now offer reduced rates (wholesale or avoided-cost rates) for exported solar. If your utility pays only $0.04/kWh for exports while charging $0.20/kWh for consumption, oversizing your system provides diminishing returns. Size your system to match your annual consumption, not to maximize production.
Panel degradation reduces savings over time. Solar panels lose about 0.3-0.5% of output per year according to NREL research. A system producing 10,500 kWh in year one produces about 9,700 kWh in year 25. Most payback calculations already account for this, but check that your installer's projections include degradation rather than assuming flat production.
Roof condition can add hidden costs. If your roof needs replacement within 10 years, do it before solar installation. Removing and reinstalling panels for a roof replacement costs $2,000-$5,000 and extends your effective payback. A new roof plus solar installed together is the most cost-effective sequence.
How Location Affects Your Payback Period
Two homes with identical solar systems, identical financing, and identical hardware can have payback periods that differ by 8+ years. The gap comes down to three location-dependent factors: sun hours, electricity rate, and state incentives. Here is how the math plays out across different parts of the country.
Arizona gets 6.5-7.5 peak sun hours per day. An 8 kW system there produces roughly 13,000-14,000 kWh annually. But Arizona electricity rates average $0.13/kWh — below the national average. Annual savings come to about $1,700-$1,800. With a net system cost of $16,800 after the federal ITC, payback lands around 9-10 years. Abundant sunshine alone does not guarantee a fast payback when electricity is cheap.
Massachusetts gets only 4.0-4.5 peak sun hours. That same 8 kW system produces about 9,500-10,500 kWh per year — 30% less than Arizona. Yet Massachusetts electricity averages $0.28/kWh, and the state offers additional incentives through the SMART program (Solar Massachusetts Renewable Target) worth $0.04-$0.08 per kWh produced. Annual savings plus SMART payments reach $3,000-$3,500. Payback: 5-6 years. Less sun, but much higher electricity rates and strong state programs make Massachusetts one of the best solar markets in the country.
Texas sits in the middle on sun hours (5.5-6.5 peak hours) but has among the lowest electricity rates ($0.12-$0.14/kWh) and no state solar incentives. Annual savings on an 8 kW system run about $1,500-$1,700. Payback: 10-12 years. Texas proves that sunshine without supportive rate structures and incentives produces mediocre returns. The exception is areas served by cooperatives or utilities with frequent rate increases — locked-in solar production becomes more valuable each year as grid rates climb.
California has high sun (5.5-6.0 peak hours) and high electricity rates ($0.30-$0.40/kWh in tiers 2 and 3), but the state recently shifted from full retail net metering to the reduced-rate NEM 3.0 tariff. Under NEM 3.0, exported solar is worth $0.05-$0.08/kWh instead of the full retail rate. Self-consumed solar still offsets $0.30+/kWh, so the key to a fast California payback is maximizing self-consumption — pairing solar with battery storage to shift energy use, or timing heavy loads (EV charging, pool pumps, laundry) during peak solar hours.
The takeaway: always run your payback calculation with your actual electricity rate and confirmed state incentives, not national averages. A 2-year difference in payback can mean $5,000-$10,000 in lifetime savings. Use the solar panel size calculator to estimate your local production requirements, then plug those numbers into your payback math.
When Solar Does Not Make Financial Sense
Solar is a strong investment for most homeowners, but not all. Recognizing when the numbers do not work saves you from a 25-year commitment that underperforms a basic index fund.
You pay under $0.10/kWh for electricity. At rock-bottom rates, an 8 kW system producing 11,000 kWh saves only $1,100 per year. After the ITC, your $16,800 net cost takes 15+ years to recoup. Meanwhile, that $16,800 invested at a 7% average annual return doubles in about 10 years. In low-rate markets, the financial case for solar is weak unless you expect rates to rise 5%+ annually.
Your roof faces north or has heavy shading. A north-facing roof in the northern hemisphere receives 30-40% less solar energy than a south-facing one. Add tree shading that blocks direct sun for 3-4 hours per day, and your system might produce only 55-60% of its rated capacity. Production that low stretches payback beyond 15 years. An optimal panel angle and clear sightlines are prerequisites, not bonuses.
You plan to move within 3 years. While solar adds resale value, the selling process introduces friction — appraisals may not fully capture solar value, buyers may be skeptical, and you lose the ongoing electricity savings you were counting on. If your timeline is under 3 years and you cannot sell the system at close to its remaining value, the return may not justify the effort.
Your utility has eliminated net metering. Without net metering or with severely reduced export rates, any solar energy you cannot use in real time earns pennies per kWh. If your daytime consumption is low (you work away from home all day) and you do not have battery storage, 40-60% of your production may be exported at $0.03-$0.05/kWh. This dramatically weakens the economics. Battery storage can fix this, but it adds $8,000-$15,000 to system cost and extends payback further.
None of these scenarios mean solar is a bad technology — they mean the financial return for your specific situation does not justify the investment right now. Environmental motivation, energy independence, and backup power value are separate considerations that some homeowners weigh alongside pure ROI. For off-grid properties where grid connection itself is expensive, the economics shift — see our off-grid load calculation guide for that analysis.
As you learned in our solar panel output guide, actual production depends on panel orientation, shading, and local weather patterns. A south-facing roof at the optimal angle produces 15-25% more than an east or west-facing installation. Get at least three installer quotes and compare their production estimates — disagreements of 15%+ suggest someone is being overly optimistic or conservative. The solar panel size estimator lets you test different system sizes and see how each variable affects your payback timeline.
Frequently Asked Questions
Written and maintained by Dan Dadovic, Commercial Director at Ezoic Inc. & PhD Candidate in Information Sciences. He works professionally as Commercial Director at Ezoic Inc., leading revenue strategy across digital publishing.
Disclaimer: Calculator results are estimates based on theoretical formulas. Actual performance varies with temperature, battery age, load patterns, and equipment condition. For critical electrical work, consult a licensed electrician.
Editorial review by Doc. dr. sc. Damir Topić, Assistant Professor, FERIT Osijek.