The Real Cost of Charging an Electric Car
Last updated:
12 min read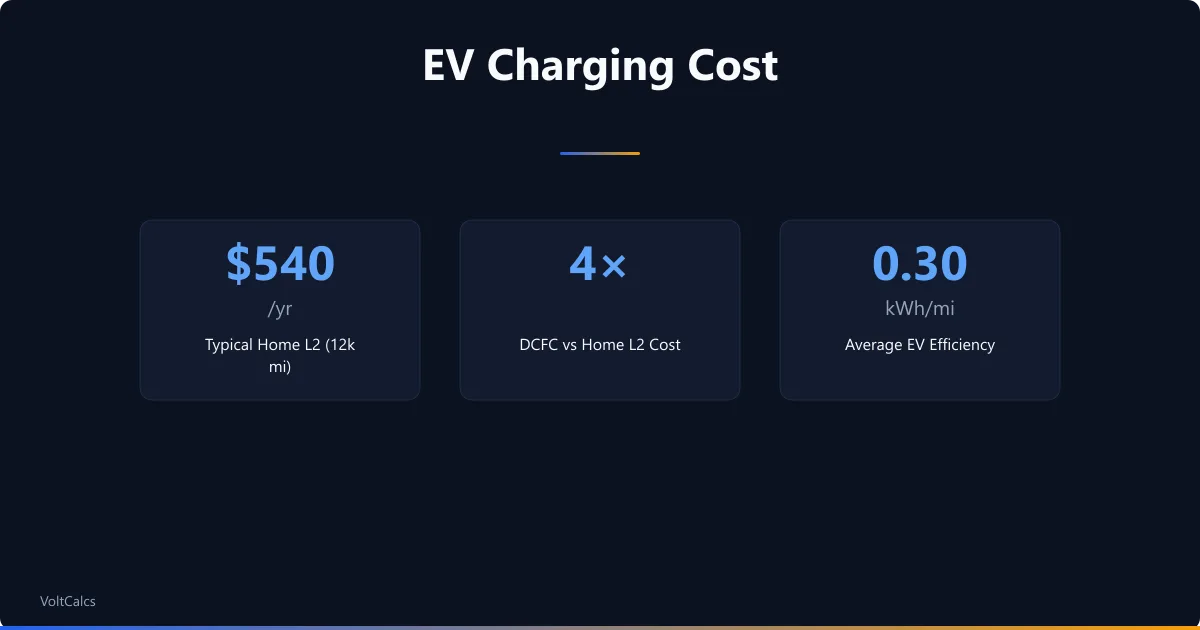
Two households can buy the same EV, drive it the same number of miles, and end up with annual charging costs that differ by a factor of six. One pays $300, the other pays $1,800, and the difference is not the car. It comes down to where they plug in, when they plug in, what charger level they use, and how many miles each kWh actually carries them. The EV charging cost calculator handles a single scenario at a time. This guide walks through the four levers that drive the spread, the five real driver profiles where the math actually lands, and the small costs around the per-kWh rate that never show up on a charger's price sticker.
The Same EV Costs $300 a Year for One Owner and $1,800 for Another
Residential electricity rates per the EIA currently span $0.10/kWh in cheaper utility territory to $0.50/kWh on Hawaii — a 5× spread before you even consider the car. Add a time-of-use rate plan and the per-kWh number can drop another 40-50% on overnight EV charging. The result is that "the cost to charge an EV" is not a single number; it is a multiplication of several numbers, each of which the driver controls more than they realize.
The DOE Alternative Fuels Data Center reports that the average new EV consumes about 0.30 kWh per mile. A 12,000-mile-per-year driver therefore needs about 3,600 kWh of grid energy delivered into the battery — but the grid kWh actually purchased is higher than that, because charging losses run 8-15% depending on level and temperature. Multiply 3,600 by 1.10 to get 3,960 kWh of grid draw, and multiply that by your effective per-kWh rate, and you have the annual fuel bill.
Run the math at three reasonable rates: a flat $0.16/kWh residential rate (close to the US average) yields $634/year. A $0.09/kWh off-peak TOU rate yields $356/year. A 90/10 mix of public DCFC at $0.45/kWh and home L2 at $0.16/kWh yields $1,690/year. Same car, same miles, completely different bills. For deeper background on how rate, demand, and delivery charges combine into the per-kWh number, our guide to electricity bill components walks through each layer.
This is why "EV charging is cheap" and "EV charging is expensive" are both true claims, posted by drivers on opposite sides of a wide cost spread. Neither claim is wrong on its own — they are both correctly calibrated to the lever combinations the speakers happen to use. The point of the guide that follows is to give you control over those levers, not to argue for one fixed answer.
Lever 1: Where You Plug In
The biggest cost driver is the location of the plug. Home charging on residential utility rates costs whatever electricity costs in your area — typically $0.10-0.20/kWh, with outliers high (Hawaii at $0.40+, California's evening peak at $0.45+) and low (Pacific Northwest at $0.08-0.10). Workplace and grocery-store L2 chargers are often free or subsidized, because the host wants the foot traffic or the employee benefit; on the chargers that bill the driver, expect $0.20-0.35/kWh.
Public DCFC stations sit in an entirely different price tier. Operators charge $0.30-0.55/kWh because they amortize $50,000-200,000 of equipment, dedicated electrical service, and demand charges across each session. EVgo, Electrify America, and Tesla Supercharger pricing varies by membership tier and time of day; a one-off DCFC session at a non-member rate routinely runs $0.45-0.55/kWh.
The location lever is where most of the apartment/condo gap originates. A homeowner with a garage or driveway can install L2 charging once and then permanently pay residential rates. An apartment dweller without on-site charging chooses among four imperfect options: workplace L2 (free but only when at work), public L2 ($0.25-0.35/kWh and slow), public DCFC ($0.40-0.55/kWh and fast), or home L1 from a long extension cord (slow but cheap). Most apartment-based EV owners end up with a mix that averages $0.25-0.30/kWh, roughly double what a homeowner on flat rate pays.
Location also determines whether time-of-use rate plans help you. Home charging can shift entirely to off-peak; public charging cannot. Apartment-based EV ownership trades the convenience of always-charged-at-home for a structurally higher per-kWh cost that no rate plan can fix. Before signing a lease in a no-charging building, factor an extra $300-700 per year into the cost of EV ownership, depending on driving distance and local public-charging rates. Our cost-per-kWh calculator turns any rate into a quick annual estimate when you know the kWh figure.
Lever 2: When You Charge
If you have residential service and the option of a time-of-use rate plan, the timing of your charging is the cheapest controllable variable in the entire equation. TOU plans split the day into peak, mid-peak, and off-peak windows. Peak windows usually run 4-9 PM in summer (when the grid is stressed by air conditioning) and 5-9 AM and 4-9 PM in winter. Off-peak windows usually run 11 PM to 6 AM. Peak rates are 2-4× the off-peak rate; some California TOU plans have peak/off-peak ratios of 5:1.
EVs are the easiest load to shift to off-peak because charging happens overnight by default. Most EV charging cables, wall connectors, and infotainment systems include a built-in scheduler. Set the start time to 11 PM (or whatever your off-peak window starts), and the car will not draw power until the rate flips. You never think about it again.
The annual savings from this single setting are larger than they look. A driver charging 3,600 kWh per year on a flat $0.16/kWh rate spends $576. The same driver on a TOU plan with $0.09/kWh off-peak spends $324. That is $250 a year saved by writing one number into the car's charging app. Some utilities offer EV-specific rate plans where the off-peak window stretches longer (10 PM to 7 AM) and the rate drops further; if your utility offers one, the enrollment is usually a 5-minute web form and the savings start immediately.
The catch with TOU plans is that they raise the on-peak rate too. If the rest of your household runs the AC hard from 4-9 PM in summer, the on-peak rate can erase the EV savings on the rest of your bill. Before switching, run your last 12 months of usage against both the flat rate and the TOU rate; most utilities offer a free "rate comparison" tool that does this in a few clicks. Our electricity bill estimator walks through the same comparison if your utility's tool is missing.
Lever 3: Charger Level and the Installation Math Behind It
Level 1, Level 2, and DC Fast Charging differ in three ways: speed, efficiency, and installation cost. Speed is the obvious one — L1 adds 3-5 miles of range per hour, L2 adds 20-40 miles per hour, DCFC adds 100-300 miles in 20-30 minutes. Efficiency is the second axis: L1 is roughly 85% efficient at delivering grid energy into the battery, L2 about 90%, DCFC about 92%. The 5% gap between L1 and L2 sounds small but compounds over 12,000 miles a year. A driver charging exclusively on L1 pays for about 4,000 grid kWh; the same driver on L2 pays for about 3,800. Five years of compounded difference is roughly $160 at average rates.
Installation cost is where the L1 vs L2 decision lives. L1 needs no installation if you have any 120V outlet near where you park; the cable shipped with the car is enough. L2 installation costs $500-1,500 for most homes — a 30-50A double-pole breaker, a run of 6/3 or 8/3 wire to the parking spot, and the wall connector itself. The cost runs higher if your panel is full and needs an upgrade or if the run from the panel to the parking area is long.
The math on whether L2 is "worth it" depends on miles driven, not absolute cost. A driver who only puts 4,000 miles a year on the car can charge from L1 indefinitely — overnight at 3-5 mi/hr more than covers a 10-15 mi/day commute. A 15,000+ mile driver hits the L1 ceiling because there are not enough hours in the night to refill the battery between trips. That driver needs L2 just to keep up with consumption.
DCFC is not really an installation decision; almost no one installs DCFC at home (the equipment costs $20,000+ and pulls 200A+ of service). DCFC is a use-case decision: do you take road trips, and how often? If yes, the cost is $0.40-0.50/kWh at stations, paid only on the trip days. To plan whether your existing electrical service can handle a new L2 charger plus your other loads (HVAC, water heating, stove), our electrical load calculator applies the NEC demand-factor math.
Lever 4: How Far You Drive Each Kilowatt-Hour
The fourth lever is the car itself. Two EVs in the same garage can pull wildly different amounts of energy per mile. A 2024 Tesla Model 3 RWD with the small battery sips about 0.24 kWh per mile in mixed driving. A Ford F-150 Lightning Extended Range pulls 0.48 kWh per mile under the same conditions. Both are good vehicles for their use cases; the Lightning just needs twice as much electricity to travel the same distance.
Manufacturer EPA combined ratings tell you the official number, but real-world efficiency varies 70-130% from EPA. The two biggest swings are speed and temperature. At 75-80 mph on a highway, an EV's aerodynamic drag dominates and efficiency drops 15-25% from EPA. Below 65 mph the difference shrinks fast. In cold weather the picture gets worse: at 20°F, EV efficiency drops 20-30% versus 70°F, because the battery preconditioning system pulls energy to keep the pack warm and the cabin heater runs continuously.
The cold-weather penalty is the single biggest surprise for first-year EV owners. A car that gets 4.0 mi/kWh in October may only get 2.7-3.0 mi/kWh in January. The bill goes up proportionally. Heat pumps in newer EVs (Tesla, Hyundai/Kia, Ford post-2023) cut the cold-weather hit roughly in half compared to older resistive-heater designs. Garage parking helps; preconditioning the cabin while still plugged in helps more, because the energy comes from the wall instead of the battery.
Tire choice and load matter too, in smaller doses. All-season tires inflated to spec roll about 5-8% more efficiently than oversized winter tires at low pressure. A roof rack with a cargo box can drop highway efficiency 15-20%. None of these are dominant levers, but they explain why a particular trip's energy use diverges from EPA's 0.30 kWh/mile baseline. The combined effect is that an EV's efficiency is not a fixed number on the window sticker — it is a year-round average that swings 30-50% from worst-day to best-day even in mild climates.
Five Real Driver Profiles, Priced Out
Stack the four levers together and the cost spread shows up clearly. Here are five archetypes that cover most of the EV-owning US, with the per-year math for each.
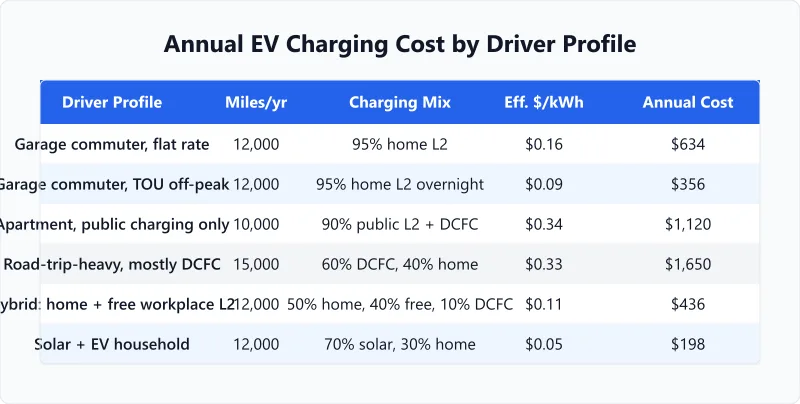
The garage commuter on flat rate. 12,000 mi/year, home L2 only, $0.16/kWh utility rate, average 0.30 kWh/mi. Annual: 3,960 grid kWh × $0.16 = $634. Modest cost; the typical baseline most cost-comparison articles quote.
The garage commuter on TOU off-peak. Same driving, same car, but enrolled in a TOU rate plan with overnight charging at $0.09/kWh. Annual: 3,960 × $0.09 = $356. The single rate-plan switch saves $278/year vs. the flat-rate version. This is where the cheapest US EV charging actually happens.
The apartment dweller without home charging. 10,000 mi/year, mostly public L2 at $0.32/kWh, occasional DCFC at $0.45/kWh. Average effective rate: about $0.34/kWh including session fees. Annual: about 3,300 grid kWh × $0.34 = $1,120. Twice the bill of the garage commuter even though they drive less. The hidden cost the EV-marketing brochures rarely mention.
The road-trip driver leaning on DCFC. 15,000 mi/year, of which 60% is corridor DCFC at $0.45/kWh and 40% is home L2 at $0.16/kWh. Effective annual: 5,000 grid kWh × $0.33 weighted = $1,650. The math punishes road-trip-heavy use; the EV's home-cost advantage gets erased on out-of-state weeks.
The hybrid lifestyle owner with workplace charging. 12,000 mi/year, of which 50% is home L2 at $0.16/kWh, 40% is free workplace L2, and 10% is occasional DCFC at $0.45/kWh. Effective rate: about $0.11/kWh weighted. Annual: 3,960 × $0.11 = $436. Workplace charging is the secret weapon; if you can get it, the per-kWh number drops faster than any single utility rate plan can manage.
The solar-plus-EV household. 12,000 mi/year, 70% charged from rooftop solar at near-zero marginal cost, 30% from home L2 at $0.16/kWh. Effective rate: about $0.05/kWh. Annual: 3,960 × $0.05 = $198. The lowest tier of EV charging cost in the US, achievable for any homeowner with a southerly roof and a 6-10 kW array. Run the payback math on the panel investment with our solar ROI calculator before assuming this profile fits your situation.
The spread from cheapest to most expensive in this set is roughly $200 to $1,650 — over 8×. The car is the same all five times.
The Costs That Don't Show on the $/kWh Sticker
Per-kWh cost is the biggest line item but it is not the entire bill. Five smaller costs accumulate around it.
Installation. A typical L2 install runs $500-1,500. Annualized over a 10-year hold of the car, that adds $50-150/year to the EV's true charging cost. If your panel needs an upgrade to take a new 50A circuit, add $1,500-4,000 more, which extends the per-year impact to $200-450/year — a meaningful adjustment to the comparison vs. gasoline.
Demand charges and idle fees. Some utilities charge residential customers a demand fee on the highest 15-minute power draw of the month. EV charging at 7.2-11.5 kW from L2 can trigger or raise that fee. Idle fees at public DCFC stations charge $0.40-1.00/minute after a session ends if the car is left plugged in; a forgotten dinner stop can add $20-40 to a single session.
Subscription fees. EVgo, Electrify America, ChargePoint, and Tesla all offer monthly memberships that lower per-kWh rates by 20-30% in exchange for $4-13/month. Worth it if you DCFC weekly; not worth it for occasional use.
Battery degradation. Frequent DCFC use slightly accelerates battery aging — 5-8% extra capacity loss over 10 years vs. exclusive home charging. The cost is paid at trade-in, not on the monthly bill, but it is real.
Standby loss. A car left plugged in but fully charged loses 1-2% of pack capacity per day to vampire drain (cabin pre-conditioning, sentry mode, software updates). Over a year, that is $30-80 in extra charging if you never unplug. Smart-charge schedules and disabling sentry mode while parked at home recover most of it.
Picking the One Lever Worth Optimizing First
Five drivers, four levers, and a cost spread of 8× makes the picture sound complicated. In practice, the optimization is simple: identify which lever is the worst in your situation, fix that one, and re-evaluate.
If your bill is high because you only use public charging, install home L2 if you can — the install pays back in 6-18 months for any moderate-mileage driver. If you cannot install home L2 (apartment, condo, on-street parking), get aggressive about workplace and grocery-store free chargers; even a 30% shift to free L2 cuts annual cost by $300-500.
If your home L2 bill is higher than expected, switch to a time-of-use rate plan. The 5-minute enrollment yields the biggest dollar-per-effort return of anything on this list. If your utility does not offer TOU rates yet, ask — most US utilities are rolling them out for residential EV customers.
If your EV's efficiency is the worst-case lever — large truck or SUV in a cold climate — the correction is behavioral, not technical. Precondition the cabin while plugged in, drive in eco mode, slow down on the highway from 75 to 65 mph, and accept that winter charging costs run 25-40% higher than summer.
Solar is the long-game lever; it is the only one that approaches zero marginal cost, but it requires homeownership and a multi-year payback view. For households making that calculation, our household electricity audit guide covers the bigger picture of where the bill goes before adding solar to it. Once the bill is right-sized, EV charging stops being the dominant line item — and the spread between $300 a year and $1,800 a year collapses in favor of a few hundred dollars on the cheap end.
Frequently Asked Questions
Written and maintained by Dan Dadovic, Commercial Director at Ezoic Inc. & PhD Candidate in Information Sciences. He works professionally as Commercial Director at Ezoic Inc., leading revenue strategy across digital publishing.
Disclaimer: Calculator results are estimates based on theoretical formulas. Actual performance varies with temperature, battery age, load patterns, and equipment condition. For critical electrical work, consult a licensed electrician.
Editorial review by Doc. dr. sc. Danijel Jerković-Štil, Assistant Professor, FERIT Osijek.