What Are Peak Sun Hours?
Peak sun hours are not the same as daylight hours. One peak sun hour equals one hour of sunlight at 1,000 watts per square meter (the intensity used to rate solar panels). A location with 5 peak sun hours might have 10 hours of daylight, but only 5 hours' worth of strong enough sun to match rated output.
Phoenix averages 6.5 peak sun hours. Seattle averages 3.5. London sits around 2.5-3. This single number is the biggest factor determining your system's actual output. You can look up your location on the NREL PVWatts tool or Global Solar Atlas for an accurate local figure.
Seasonal variation matters too. Phoenix drops from about 7.5 peak sun hours in June to 5.2 in December. If you are sizing an off-grid system, use the worst month (not the annual average), or you will run short in winter. Our solar panel angle calculator shows how tilt adjustments can help maximise winter capture.
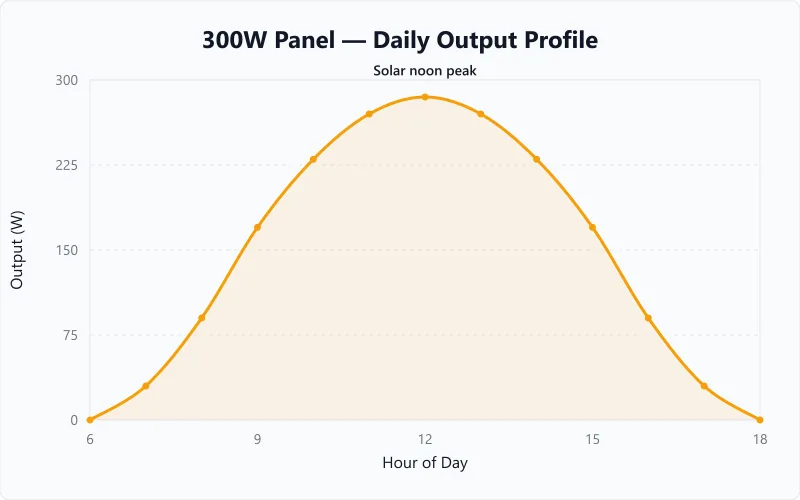
How Output Changes From Sunrise to Sunset
The bell curve above shows why a panel's rated wattage is a ceiling it touches only briefly. A 300W panel sits near zero at dawn, climbs as the sun rises, and peaks close to its rating at solar noon when sunlight strikes the surface most directly. By mid-afternoon it tapers off again, reaching zero at dusk. The total energy you harvest is the area under that whole curve, not the noon peak alone.
This is why peak sun hours work as a shortcut: they compress the entire curve into an equivalent number of hours at full rated output. A panel that touches 285W for a moment at noon and produces far less morning and evening might deliver the same daily total as five hours at its full rating, which is what "5 peak sun hours" means. Cloud cover flattens the curve; a clear day in June stretches it far wider than a short day in December.
Daily Output by Panel Size and Sun Hours
The math behind every result is the same: rated watts × peak sun hours × 0.85 for typical losses. This table runs that calculation for common panel sizes at three sun-hour levels, so you can estimate daily output at a glance before reaching for the calculator.
| Panel Rating | 4 Sun Hours | 5 Sun Hours | 6 Sun Hours |
|---|---|---|---|
| 100W | 0.34 kWh | 0.43 kWh | 0.51 kWh |
| 200W | 0.68 kWh | 0.85 kWh | 1.02 kWh |
| 300W | 1.02 kWh | 1.28 kWh | 1.53 kWh |
| 400W | 1.36 kWh | 1.70 kWh | 2.04 kWh |
| 450W | 1.53 kWh | 1.91 kWh | 2.30 kWh |
| 550W | 1.87 kWh | 2.34 kWh | 2.81 kWh |
To turn any daily figure into a monthly estimate, multiply by 30; for a year, multiply by 365. A single 400W panel at 5 peak sun hours, for example, clears more than 600kWh a year on its own.
Annual Output by US Region
Location is the single biggest variable in solar output. The table below lists the energy a single south-facing 400W panel produces in a year across twelve US cities, using each city's peak sun hours from NREL solar resource data at latitude tilt and the same 15% loss allowance. Look up your own location on NREL PVWatts for a local figure.
| City | Peak Sun Hours | Annual Output (400W panel) |
|---|---|---|
| Las Vegas, NV | 6.69 | 830 kWh |
| Phoenix, AZ | 6.68 | 829 kWh |
| Albuquerque, NM | 6.57 | 815 kWh |
| Los Angeles, CA | 6.06 | 752 kWh |
| Denver, CO | 5.85 | 726 kWh |
| Miami, FL | 5.63 | 699 kWh |
| Atlanta, GA | 5.09 | 632 kWh |
| Kansas City, MO | 4.97 | 617 kWh |
| Houston, TX | 4.96 | 616 kWh |
| New York, NY | 4.62 | 573 kWh |
| Chicago, IL | 4.50 | 558 kWh |
| Seattle, WA | 3.98 | 494 kWh |
A panel in Las Vegas out-produces the same panel in Seattle by about 68% over a year, purely on available sunshine. That gap is why off-grid systems in cloudy regions need more panels and larger battery banks than identical loads would require in the Southwest.
Where the 15% System Loss Comes From
Solar panels never hit their rated output in real conditions. Temperature alone costs 5-10% — panels are rated at 25°C (77°F) but rooftop panels regularly reach 50-60°C in summer. Every degree above 25°C reduces output by about 0.35% for monocrystalline panels. On a 40°C day, surface temperatures can reach 65°C, costing you roughly 14% from temperature alone.
Wiring resistance loses another 2-3%. Dust and dirt reduce output 2-5% depending on cleaning frequency. Inverter conversion adds 3-5% loss. Shading is the wild card — even partial shade on one cell can cut an entire string's output by 30-50% if your system lacks optimisers or microinverters.
The 15% default is conservative for a clean, well-installed system. Increase it to 20-25% if panels sit under trees, collect heavy dust, or face anything less than due south (in the northern hemisphere). Flat-mounted panels on commercial roofs often need 20% to account for suboptimal tilt.
Stacking those factors gives a typical derate from the lab rating down to delivered output:
| Stage | Typical Loss | Output Remaining |
|---|---|---|
| STC nameplate rating | 0% | 100% |
| Cell temperature above 25°C | ~8% | ~92% |
| Soiling, dust, and snow | ~2% | ~90% |
| Mismatch and DC wiring | ~3% | ~87% |
| Inverter conversion | ~4% | ~84% |
| Shading, age, and availability | ~6% | ~78% |
These figures follow the NREL PVWatts loss model, which combines them multiplicatively rather than adding them up. A clean, well-sited array lands near 78-82% of nameplate; a hot, dusty, or partly shaded one can fall below 70%. The calculator's 15% default sits at the optimistic end of this stack, so dial it toward 20-25% for harsher sites.
Worked Examples
Grid-Tied 8kW Array on a Suburban Roof
Context
Calculation
Daily output = Panel Wattage × Sun Hours × (1 − Loss%) × Panel Count
= 400W × 4.97h × 0.85 × 20
= 33,796Wh, about 33.8kWh per day
Annual output = 33,796 × 365 = 12,335,540Wh, about 12,335kWh per year
Interpretation
At roughly 12,335kWh a year, this array generates more than the 10,791kWh an average US home uses annually. On a yearly basis it can offset nearly all of the home's grid electricity, but daytime production and evening demand rarely line up, so a battery bank sized to the nighttime load or a net-metering arrangement is what closes the gap.
Takeaway
At about 17 cents per kWh, the US average residential rate (rates vary widely by state), 12,335kWh is worth roughly $1,800 to $2,000 a year in avoided electricity, though net-metering rules determine how much of the midday surplus actually counts. Output also swings with the seasons, running well above this average on clear summer days and below it in December.
Portable Camping Setup in Arizona
Context
Calculation
Daily output = 100W × 6h × 0.75 × 2 panels
= 100 × 6 × 0.75 × 2 = 900Wh (0.9kWh per day)
Interpretation
At 900Wh/day, this setup comfortably charges phones, runs LED lights, and keeps a small 12V cooler cold. It won't handle heavy loads like a microwave or hair dryer.
Takeaway
If 900Wh isn't enough for your camping loads, use our battery runtime calculator to figure out exactly which appliances fit within your daily energy budget before your next trip.
Frequently Asked Questions
Glossary
Peak Sun Hours
The number of hours per day when solar irradiance averages 1,000 W/m². A location with 5 PSH receives the energy equivalent of 5 hours at full-rated intensity, even though actual daylight may last 10-12 hours.
System Losses
The combined efficiency reductions from temperature, wiring resistance, dust, inverter conversion, and shading. A well-maintained system typically loses 12-18% of rated output to these factors.
Irradiance
The power of sunlight hitting a surface, measured in watts per square meter (W/m²). Standard test conditions use 1,000 W/m² as the reference for panel ratings.
Degradation Rate
The annual percentage reduction in a solar panel's output over its lifespan. Most modern panels degrade 0.3-0.5% per year, retaining 80-85% of original output after 25 years.
Wondering how long it takes to recharge your batteries from solar? Our battery charge time calculator gives you a clear answer.
Related calculators
Solar Panel Calculator
Free solar panel calculator: enter your daily energy use and sun hours to get the panel wattage and number of panels for a home, RV, or off-grid setup.
Solar
Solar Watts to Amps Calculator
Convert solar panel output from watts to amps at any system voltage. Use the result to size wires, fuses, and charge controllers.
Solar
Solar Time Calculator
Calculate apparent solar time and solar noon for any location. Enter longitude and date to find when the sun is highest.
Solar
Solar Panel Angle Calculator
Find the optimal tilt angle for your solar panels by latitude and season. Maximize energy output with the right panel angle.
Solar
Solar output varies daily and seasonally. The number this calculator gives you is a useful average — some days you will produce more, some less. For off-grid systems, size your panels and batteries for the worst month, not the average. For grid-tied setups, annual totals matter more than any single day. To evaluate the financial payback of your system, run your production figures through our solar ROI calculator.
More Solar calculators
Browse all solar calculators — Panel output, battery bank sizing, charge time, and system design for off-grid, RV, and residential setups.
Last updated:
Written and maintained by Dan Dadovic, Commercial Director at Ezoic Inc. & PhD Candidate in Information Sciences. He works professionally as Commercial Director at Ezoic Inc., leading revenue strategy across digital publishing.
Disclaimer: Calculator results are estimates based on theoretical formulas. Actual performance varies with temperature, battery age, load patterns, and equipment condition. For critical electrical work, consult a licensed electrician.
Editorial review by Doc. dr. sc. Damir Topić, Assistant Professor, FERIT Osijek.