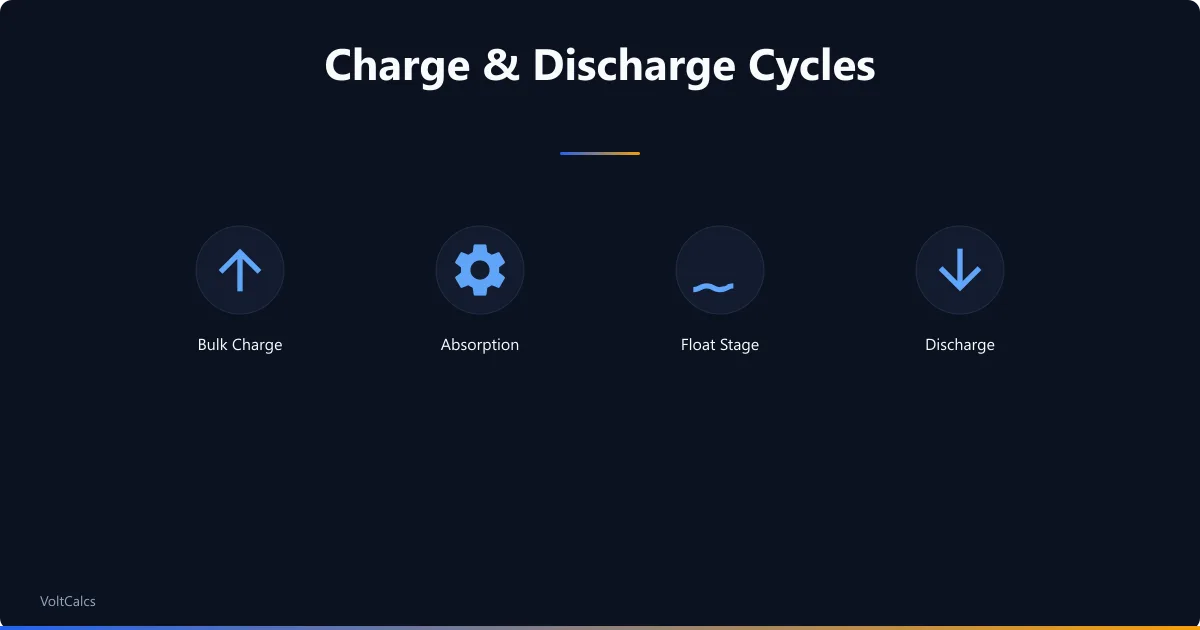
Example: A Day in the Life of an Off-Grid Battery
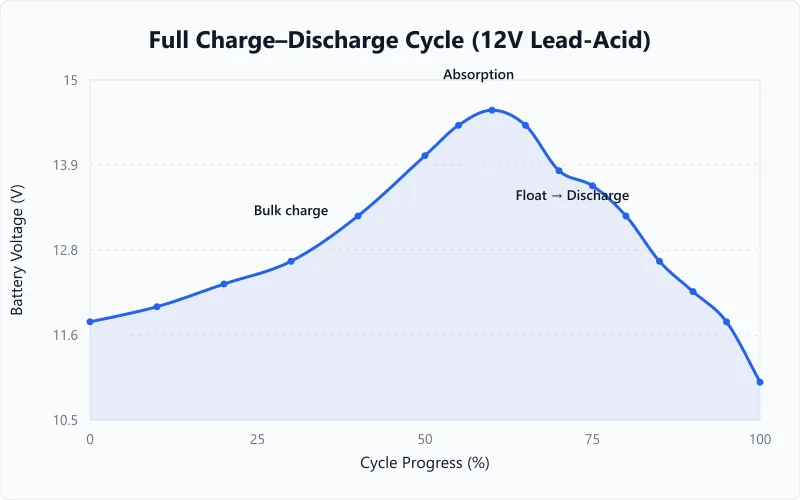
Here is one closed 24-hour cycle for a 200Ah 12V LiFePO4 bank on a cabin with solar panels. Every figure below comes from the calculator above at the same settings.
Morning (7 AM - 10 AM): The bank starts at about 29% SOC after the overnight loads. Panels come up with the sun and the charge controller puts a net 15A into the batteries after the daytime loads are covered, so 45Ah by 10 AM lifts the bank to roughly 51.5%.
Midday (10 AM - 1 PM): Peak production, and the controller ramps to 30A. The 97Ah still missing takes 3 hours 14 minutes: 2 hours 54 minutes of bulk at the full 30A, then 20 minutes of absorption for the last 10Ah while the current tapers. The bank is full by about 1:14 PM, and after that any excess solar is wasted unless you have a dump load.
Evening (5 PM - 11 PM): Production is zero. The bank runs lights (60W), the fridge (50W average), a TV (80W) and phone charging (15W), 205W in total. At 80% depth and 90% efficiency the 200Ah pack holds 1,843Wh of usable energy, which is 9.0 hours at this load, or 8 hours 59 minutes on the clock. Six evening hours take 1,367Wh out of the bank, leaving it at about 46.6%.
Overnight (11 PM - 7 AM): Only the fridge runs, averaging 50W. That is 400Wh of work and 444Wh out of the bank over eight hours, and the night ends at about 29%, where the day started. The loop closes, which is the whole test: a system that ends each night lower than it started is losing ground, and no amount of good weather next week fixes it.
Cycle Life as the Makers Print It
Cycle-life numbers are quoted loosely all over the internet, so this table quotes nobody but the manufacturers, and names the model line and the depth each figure was printed against. A "cycle" is a discharge to the stated depth followed by a full recharge.
| Battery, as the maker names it | 30% DoD | 50% DoD | 70% DoD | 80% DoD | 100% DoD |
|---|---|---|---|---|---|
| Victron 12V Deep Cycle AGM | 1,500 | 600 | n/a | 400 | n/a |
| Victron 12V Deep Cycle GEL | 1,800 | 750 | n/a | 500 | n/a |
| Victron 12,8V LiFePO4 Smart | n/a | 5,000 | 3,000 | 2,500 | n/a |
| Battle Born 100Ah 12V LiFePO4 | n/a | n/a | n/a | n/a | 3,000-5,000 |
Two gaps are worth naming rather than filling. There is no flooded row, because the flooded makers we checked publish this relationship as a chart rather than a table of numbers, and reading a value off a chart image is not the same as quoting one. There is no lithium-ion NMC row for the same reason: the cycle counts published for NMC are not tied to a stated depth of discharge, so they cannot be lined up against the rows above.
Read the shape rather than the individual numbers. Halving the depth roughly doubles the count on every row, which is why the depth of discharge box above is the single most expensive setting on the page. The cleanest comparison is Victron against itself at one depth: at 50% the company prints 5,000 cycles for its LiFePO4 Smart range and 750 for its gel range. That is 13 years of daily cycling against two. If you are choosing between chemistries on cost, that ratio matters more than the sticker price, and our deep cycle battery runtime calculator works the runtime side of the same trade.
Where These Two Numbers Come From
The discharge half. A battery does not hand back its rated amp-hours at any current. Victron says so plainly on its own datasheet: "The effective capacity decreases with increasing discharge current." So instead of dividing energy by watts, this tool fits a rate correction to the discharge tables the makers actually print, one fit per lead-acid chemistry. Flooded is fitted to the printed discharge table on Trojan's T-105 data sheet, AGM to Lifeline's GPL-31T minutes and Victron's AGM column, gel to Victron's gel column. The rate correction reproduces those printed tables within about 10% for flooded, about 6% for AGM and about 2% for gel. LiFePO4 takes no rate term at all up to 1C, and is run at the 12,8V nominal Victron prints rather than a flat 12V, which is why a 100Ah lithium pack shows 1,280Wh here and not 1,200Wh. If you want the lead-acid side on its own, the lead-acid battery runtime calculator goes further into it.
The charge half. Charging is two stages, not one. Victron's Blue Smart charger manual prints the method in full: bulk time is the amp-hours below the bulk endpoint divided by the charge current, and absorption is a separate stage on top. It puts that endpoint at "approximately 80% state of charge" for lead-acid and "well above 95%" for lithium, and it prints a worked case, a flat 100Ah lead-acid battery on a 10A charger, 8 hours of bulk plus 8 hours of absorption, 16 hours in total. Nothing in that printed method divides by an efficiency figure, and neither does this calculator.
Victron prints the driver of the absorption stage, its bounds (30 minutes to 8 hours) and that one worked value, but no rule for a partial discharge. That gap is filled by a least-squares fit to six printed totals: Victron's 16-hour case plus the five rows of NOCO's GENIUS10 charge-time chart, all at 10A and 50% depth. The fitted coefficient is 0.8571 absorption hours per amp-hour-per-amp, and it lands within 4.1% of every one of the six printed totals. Two printed floors sit under it, Victron's 30-minute absorption minimum, and East Penn's statement that a lead-acid charge returns between 105% and 130% of the amp-hours removed, which stops a shallow top-up finishing faster than the current allows. LiFePO4 is not fitted: bulk to 95%, then the last 5% at the charge current, which reproduces all three printed lithium cases exactly (Victron 10 hours at 10A, Victron 2 hours at 0.5C, Amptron 5 hours at 20A).
What that leaves is a tool whose two answers you can check against a manufacturer's own printed numbers, which is the only kind of checking worth doing. If you only need the charge side, the battery charge time calculator runs the same engine with a smaller set of inputs.
Worked Examples
Daily Solar Cycle for an Off-Grid Cabin
Context
A cabin runs 250W of evening load off a 300Ah 12V LiFePO4 bank, down to 80% depth, and recharges from a 30A solar charge controller the next day. The inverter and wiring are set to 90%, which is what Victron prints as the maximum for its small 12V units.
Calculation
Discharge: 300Ah x 12.8V nominal x 0.80 depth x 0.90 = 2,765 Wh usable, and 2,765 / 250W = 11.1 hours, or 11 hours 4 minutes.
Charge: 240Ah to put back. Bulk runs to the 95% endpoint Victron prints for lithium, so 225Ah at 30A = 7 hours 30 minutes, then the last 15Ah of absorption at the same current = 30 minutes. Total 8 hours.
Cycle ratio: 8 / 11.1 = 0.7x.
Interpretation
Eight hours of charging against eleven of discharge sounds comfortable, but the eight hours have to be eight hours of usable sun, not eight hours of daylight. In June that is easy. In December, at three or four peak sun hours, the bank finishes the day short and starts the next one lower.
Takeaway
Size the array for the worst month rather than the annual average, and check the shortfall month by month with our solar panel output calculator.
Marine Battery After a Day of Trolling
Context
A trolling motor pulls 300W straight off a 100Ah 12V flooded battery, no inverter in the path, so efficiency is set to 100%. Depth is held at 50%, which is as deep as the lead-acid makers recommend taking a bank on a regular cycle. Back at the dock, a 15A shore charger takes over.
Calculation
Discharge: 300W at 12V is 25A, a quarter of the 20-hour rating. At that rate the flooded fit gives 2.95 hours to empty, so half of it is 1.5 hours, or 1 hour 28 minutes.
Charge: 50Ah to put back. Bulk runs to the 80% endpoint Victron prints for lead-acid, so 30Ah at 15A = 2 hours, and the absorption tail is 2 hours 51 minutes on top. Total 4 hours 51 minutes.
Cycle ratio: 4.9 / 1.5 = 3.3x.
Interpretation
The absorption stage is longer than the bulk stage here, and that is the whole point of the lead-acid tail: an hour and a half of fishing costs nearly five hours on the charger. An overnight plug-in covers it easily. A quick top-up between sessions does not, and stopping the charge when the ammeter drops is exactly how a flooded battery ends up chronically undercharged.
Takeaway
If you want the discharge side broken down by trolling speed instead of watts, our marine battery runtime calculator works from thrust and amp draw.
Frequently Asked Questions
Glossary
Round-Trip Efficiency
The share of the energy put into a battery that comes back out again. Victron prints 92% for a LiFePO4 battery and 80% for the average lead-acid battery; EG4 prints 94.5% for its own EG4-LL packs. Rolls prints a related but different figure, about 80% charge efficiency for its flooded deep cycle models, which describes the charging leg alone rather than the whole cycle. The calculator on this page applies none of these: the efficiency input above is the inverter and wiring loss on the discharge side.
Absorption Stage
The second half of a charge, where the voltage is held and the current falls away as the battery fills. Victron prints its length as adaptive, between a minimum of 30 minutes and up to 8 hours for a deeply discharged lead-acid battery. On LiFePO4 it is typically under 30 minutes. It is the stage that makes a lead-acid recharge take half again as long as the amp-hours suggest.
Cycle Life
The number of full charge-discharge cycles a battery delivers before its capacity falls to 80% of new. Quote it with a depth or it means nothing: Victron prints 2,500 cycles at 80% depth, 3,000 at 70% and 5,000 at 50% for its LiFePO4 Smart range, and at that same 50% depth 750 for its gel range and 600 for its AGM range, while Battle Born prints 3,000-5,000 cycles at 100% depth. The table above has the same figures side by side.
Daily Cycle
One complete discharge and recharge period, usually following the sun in a solar system: evening loads take the bank down, the next day's sun puts it back. The depth of each cycle sets how many of them the battery has in it.
Need to size your solar array for full daily recharging? The solar panel and battery sizing calculator matches generation to consumption.
Related calculators
Battery Charge Time Calculator
Calculate how long a battery takes to charge from capacity, charger amps, and chemistry. Returns the bulk stage and the absorption stage separately.
Battery
Deep Cycle Battery Runtime Calculator
Estimate deep cycle battery runtime for marine, RV, and off-grid use. Accounts for depth of discharge and system efficiency.
Battery
Battery Voltage to Percentage Calculator
Turn a resting multimeter reading into a state of charge percentage for flooded lead-acid and AGM batteries, from the makers' own printed voltage tables.
Battery
Battery Capacity (Amp Hours) Calculator
Calculate battery capacity in amp-hours from watt-hours and voltage. Convert between Wh, Ah, and watts easily.
Battery
Modelling the complete charge-discharge cycle reveals whether your system is sustainable or slowly draining your batteries into an early grave. If the numbers above show your batteries never fully recharge, you need either more charging capacity (bigger panels, faster charger) or less load — there is no third option. For the chemistry-specific limits on how deep you can safely cycle, see our depth of discharge guide.
More Battery calculators
Browse all battery calculators — LiFePO4, lead-acid, AGM, and lithium-ion runtime, charge time, and capacity sizing.
Last updated:
Written and maintained by Dan Dadovic, Commercial Director at Ezoic Inc. & PhD Candidate in Information Sciences. He works professionally as Commercial Director at Ezoic Inc., leading revenue strategy across digital publishing.
Disclaimer: Calculator results are estimates based on theoretical formulas. Actual performance varies with temperature, battery age, load patterns, and equipment condition. For critical electrical work, consult a licensed electrician.
Methodology reviewed by Doc. dr. sc. Damir Topić, Assistant Professor, FERIT Osijek.