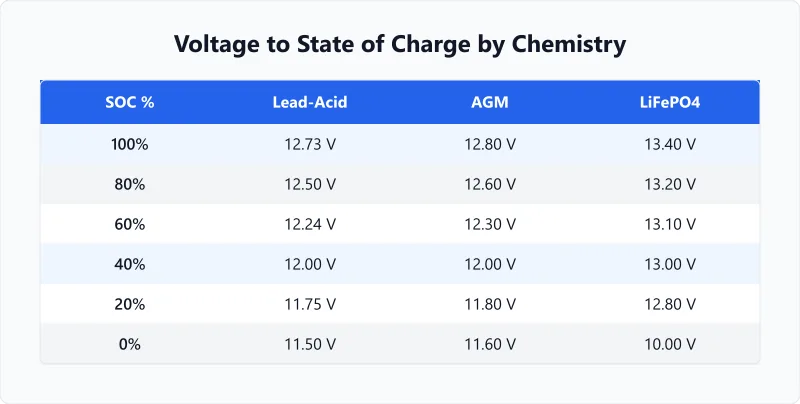
12V Battery State of Charge by Chemistry
| SOC % | Flooded Lead-Acid | AGM / Gel | LiFePO4 |
|---|---|---|---|
| 100% | 12.70V | 12.80V | 13.60V |
| 90% | 12.50V | 12.60V | 13.40V |
| 80% | 12.42V | 12.50V | 13.30V |
| 70% | 12.32V | 12.40V | 13.28V |
| 60% | 12.20V | 12.25V | 13.26V |
| 50% | 12.06V | 12.10V | 13.20V |
| 40% | 11.90V | 11.95V | 13.16V |
| 30% | 11.75V | 11.81V | 13.10V |
| 20% | 11.58V | 11.66V | 12.80V |
| 10% | 11.31V | 11.51V | 12.00V |
| 0% | 10.50V | 10.50V | 10.00V |
Notice how LiFePO4 stays between 13.1V and 13.4V from 30% to 90% SOC. That flat curve makes voltage a poor SOC indicator for LiFePO4 — a battery monitor or BMS with coulomb counting is far more accurate.
Resting Voltage vs Loaded Voltage
Voltage measured under load is always lower than resting voltage due to internal resistance. A 12V lead-acid battery at 50% SOC reads 12.06V at rest, but might show 11.5V while powering a 10A load. If you check voltage while the battery is working, you will underestimate the state of charge.
Resting voltage requires the battery to sit disconnected (or with very low parasitic loads) for 1-4 hours after the last charge or discharge event. Lead-acid needs the longest settling time — up to 4 hours for an accurate reading. LiFePO4 settles within 30-60 minutes.
Charging also skews readings upward. Immediately after disconnecting a charger, a 12V lead-acid battery may show 13.0-13.2V even though true SOC is only 80-90%. This "surface charge" dissipates after 1-2 hours, settling to the real resting voltage.
For the most accurate SOC reading: disconnect all loads, wait 2 hours, then measure. Or use a battery monitor (like a Victron SmartShunt) that tracks energy in and out — no voltage guessing needed.
Worked Examples
Checking if Your Lead-Acid Battery is Healthy
Context
Your car sat for a week. You measure 12.4V at the terminals with no load and the engine off. The battery is a standard flooded lead-acid.
Calculation
12.4V on the lead-acid voltage chart = approximately 65-70% state of charge
A healthy fully charged lead-acid reads 12.6-12.7V at rest
Interpretation
65-70% is usable but not ideal. The battery lost about 30% charge in a week, which suggests either high parasitic draw or a battery nearing end of life. A healthy battery should hold above 12.5V for weeks.
Takeaway
If the voltage drops below 12.4V regularly, test the CCA to see if the battery is failing. Estimate your minimum CCA requirement with our CCA calculator.
Why Your LiFePO4 Multimeter Reading Looks Wrong
Context
You just installed a 12V LiFePO4 battery. After charging, it reads 14.2V. After resting 30 minutes, it reads 13.4V. Under load, it reads 13.0V. Which is the "real" voltage?
Calculation
14.2V = surface charge (immediately after charging, not representative)
13.4V = resting voltage = ~100% SOC on the LiFePO4 chart
13.0V = voltage under load (reduced by internal resistance x current)
Interpretation
The resting voltage (13.4V after 30+ minutes off the charger) is the correct one for SOC estimation. LiFePO4 has an extremely flat discharge curve — it reads 13.2-13.3V from 90% down to 20% SOC, making voltage a poor indicator in the middle range.
Takeaway
For LiFePO4, a coulomb counter or BMS readout is more accurate than voltage alone. To understand how much energy that SOC represents, use our watts in a 12V battery calculator.
Frequently Asked Questions
Glossary
State of Charge
The percentage of remaining capacity in a battery, from 0% (empty) to 100% (full). SOC is estimated from resting voltage, coulomb counting, or impedance measurement. Voltage-based SOC is only accurate at rest — not while charging or under load.
Resting Voltage
The terminal voltage measured after the battery has been disconnected from all loads and chargers for at least 30 minutes. Surface charge and internal resistance effects dissipate during this rest period, giving an accurate reading for SOC estimation.
Surface Charge
A temporary voltage elevation that appears immediately after charging ends. It makes the battery look more charged than it actually is. Allow 30-60 minutes of rest before measuring voltage for SOC — or briefly apply a small load to strip the surface charge.
Building an off-grid solar setup? Use the solar panel and battery sizing calculator to match panels to your battery bank.
Related calculators
Battery Charge and Discharge Calculator
Calculate both charge and discharge times for your battery in one place. Model a complete daily battery cycle.
Battery
Lead-Acid Battery Runtime Calculator
Calculate lead-acid battery runtime with Peukert effect awareness. Compare flooded vs sealed types for real-world runtime.
Battery
LiFePO4 Battery Runtime Calculator
Estimate LiFePO4 battery runtime with accurate DoD and efficiency defaults. Compare lithium iron phosphate vs lead-acid.
Battery
Car Battery Runtime Calculator
Calculate how long a car battery powers accessories with the engine off. Know the limits before you drain your starter.
Battery
Voltage gives you a rough SOC estimate, but resting conditions and battery chemistry shift readings by 0.1-0.3V. Measure after a 2-hour rest, use the correct chart for your battery type, and accept that voltage-based SOC is an approximation — not a precise reading. How deep you discharge below that reading directly impacts battery lifespan — our depth of discharge guide details the SOC thresholds for each chemistry.
More Battery calculators
Browse all battery calculators — LiFePO4, lead-acid, AGM, and lithium-ion runtime, charge time, and capacity sizing.
Last updated:
Written and maintained by Dan Dadovic, Commercial Director at Ezoic Inc. & PhD Candidate in Information Sciences. He works professionally as Commercial Director at Ezoic Inc., leading revenue strategy across digital publishing.
Disclaimer: Calculator results are estimates based on theoretical formulas. Actual performance varies with temperature, battery age, load patterns, and equipment condition. For critical electrical work, consult a licensed electrician.
Editorial review by Doc. dr. sc. Damir Topić, Assistant Professor, FERIT Osijek.